29
/
en
AIzaSyAYiBZKx7MnpbEhh9jyipgxe19OcubqV5w
April 1, 2024
265051
Togo
TGO
true
2
1
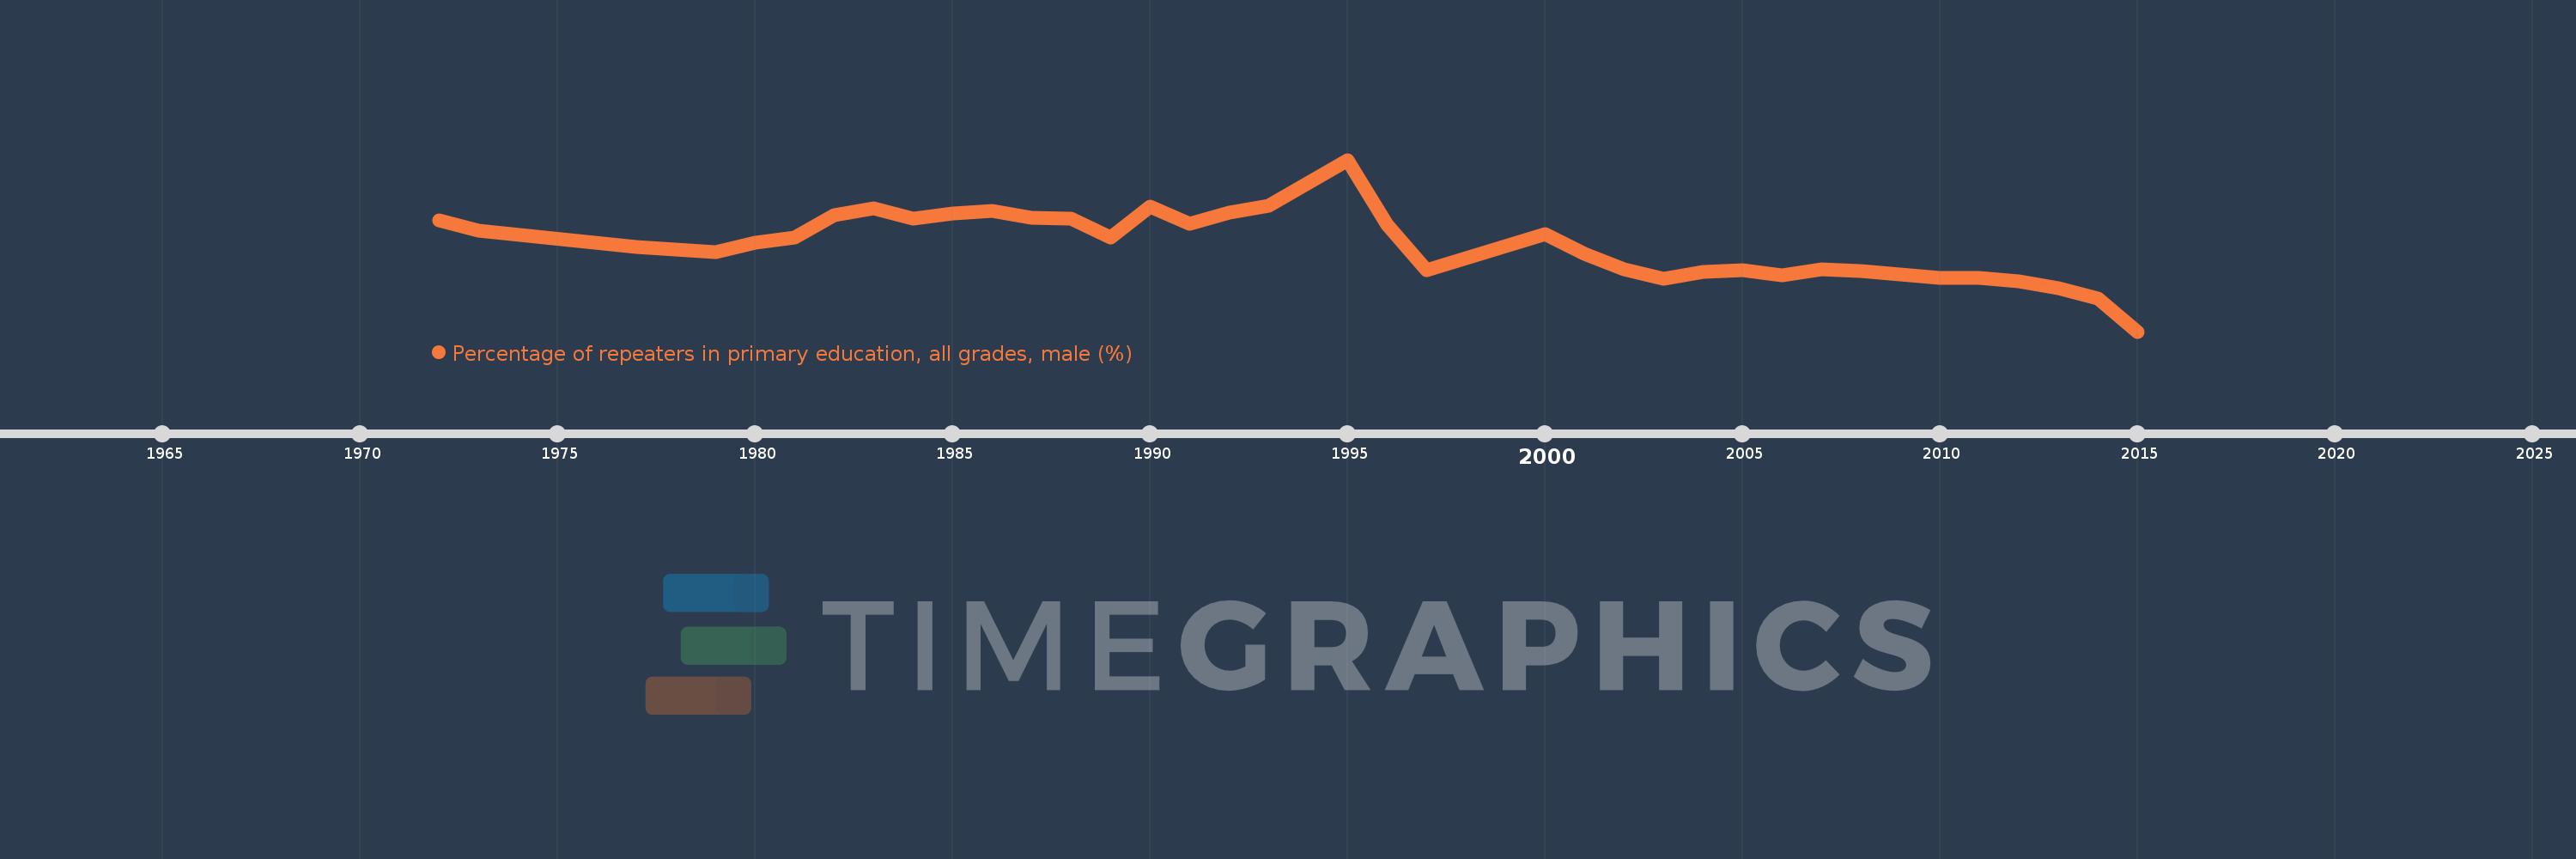
Percentage of repeaters in primary education, all grades, male (%)
2015,2014,2013,2012,2011,2010,2009,2008,2007,2006,2005,2004,2003,2002,2001,2000,1997,1996,1995,1993,1992,1991,1990,1989,1988,1987,1986,1985,1984,1983,1982,1981,1980,1979,1977,1973,1972
This statistics in other country:
AfghanistanAlbaniaAlgeriaAndorraAngolaAntigua and BarbudaArab WorldArgentinaArmeniaArubaAustriaAzerbaijanBahamas, TheBahrainBangladeshBelarusBelgiumBelizeBeninBermudaBhutanBoliviaBosnia and HerzegovinaBotswanaBrazilBritish Virgin IslandsBrunei DarussalamBulgariaBurkina FasoBurundiCabo VerdeCambodiaCameroonCanadaCaribbean small statesCayman IslandsCentral African RepublicCentral Europe and the BalticsChadChileChinaColombiaComorosCongo, Dem. Rep.Congo, Rep.Costa RicaCote d'IvoireCroatiaCubaCyprusCzech RepublicDenmarkDjiboutiDominicaDominican RepublicEarly-demographic dividendEast Asia & PacificEast Asia & Pacific (excluding high income)East Asia & Pacific (IDA & IBRD countries)EcuadorEgypt, Arab Rep.El SalvadorEquatorial GuineaEritreaEstoniaEthiopiaEuro areaEurope & Central AsiaEurope & Central Asia (excluding high income)Europe & Central Asia (IDA & IBRD countries)European UnionFijiFinlandFragile and conflict affected situationsFranceGabonGambia, TheGeorgiaGermanyGhanaGreeceGrenadaGuatemalaGuineaGuinea-BissauGuyanaHaitiHeavily indebted poor countries (HIPC)High incomeHondurasHong Kong SAR, ChinaHungaryIBRD onlyIcelandIDA & IBRD totalIDA blendIDA onlyIDA totalIndiaIndonesiaIran, Islamic Rep.IraqIrelandIsraelItalyJamaicaJapanJordanKazakhstanKenyaKiribatiKorea, Rep.KuwaitKyrgyz RepublicLao PDRLate-demographic dividendLatin America & Caribbean Latin America & Caribbean (excluding high income)Latin America & the Caribbean (IDA & IBRD countries)LatviaLeast developed countries: UN classificationLebanonLesothoLiberiaLibyaLiechtensteinLithuaniaLow & middle incomeLow incomeLower middle incomeLuxembourgMacao SAR, ChinaMacedonia, FYRMadagascarMalawiMalaysiaMaldivesMaliMaltaMauritaniaMauritiusMexicoMiddle East & North AfricaMiddle East & North Africa (excluding high income)Middle East & North Africa (IDA & IBRD countries)Middle incomeMoldovaMonacoMongoliaMontenegroMoroccoMozambiqueMyanmarNamibiaNauruNepalNetherlandsNew ZealandNicaraguaNigerNorwayOECD membersOmanOther small statesPacific island small statesPakistanPalauPanamaPapua New GuineaParaguayPeruPhilippinesPolandPortugalPost-demographic dividendPre-demographic dividendQatarRomaniaRussian FederationRwandaSamoaSan MarinoSao Tome and PrincipeSaudi ArabiaSenegalSerbiaSeychellesSierra LeoneSingaporeSint Maarten (Dutch part)Slovak RepublicSloveniaSmall statesSolomon IslandsSomaliaSouth AfricaSouth AsiaSouth Asia (IDA & IBRD)South SudanSpainSri LankaSt. Kitts and NevisSt. LuciaSt. Vincent and the GrenadinesSub-Saharan Africa Sub-Saharan Africa (excluding high income)Sub-Saharan Africa (IDA & IBRD countries)SudanSurinameSwazilandSwedenSwitzerlandSyrian Arab RepublicTajikistanTanzaniaThailandTimor-LesteTogoTongaTrinidad and TobagoTunisiaTurkeyTurks and Caicos IslandsTuvaluUgandaUkraineUnited Arab EmiratesUnited KingdomUpper middle incomeUruguayUzbekistanVanuatuVenezuela, RBVietnamWest Bank and GazaWorldYemen, Rep.ZambiaZimbabwe Timeline:
This timeline shows a graph from 1972 to 2015 of Togo. No data until 1971. Number of actual observations by date: 37.
Source name:
World Development Indicators
Source organization:
UNESCO Institute for Statistics
Categories, topics:
Education, Gender
Last updated:
apr 23, 2017
Indicators value changes by year
Minimum:
11.263
jan 1, 2015
Maximum:
45.771
jan 1, 1995
At the date of observation
Value
Absolute change
Change from previous value
jan 1, 1972
33.549
+33.549
0.0%
jan 1, 1973
31.556
-1.994
-5.94%
jan 1, 1977
28.2
-3.355
-10.63%
jan 1, 1979
27.249
-0.952
-3.37%
jan 1, 1980
29.055
+1.806
6.63%
jan 1, 1981
30.151
+1.096
3.77%
jan 1, 1982
34.727
+4.575
15.17%
jan 1, 1983
35.961
+1.234
3.55%
jan 1, 1984
33.982
-1.978
-5.5%
jan 1, 1985
35.005
+1.023
3.01%
jan 1, 1986
35.568
+0.563
1.61%
jan 1, 1987
34.134
-1.434
-4.03%
jan 1, 1988
33.994
-0.14
-0.41%
jan 1, 1989
30.169
-3.825
-11.25%
jan 1, 1990
36.434
+6.264
20.76%
jan 1, 1991
32.926
-3.508
-9.63%
jan 1, 1992
35.196
+2.27
6.9%
jan 1, 1993
36.579
+1.383
3.93%
jan 1, 1995
45.771
+9.192
25.13%
jan 1, 1996
32.678
-13.093
-28.6%
jan 1, 1997
23.599
-9.08
-27.78%
jan 1, 2000
30.861
+7.262
30.77%
jan 1, 2001
26.831
-4.03
-13.06%
jan 1, 2002
23.794
-3.037
-11.32%
jan 1, 2003
21.921
-1.873
-7.87%
jan 1, 2004
23.194
+1.273
5.81%
jan 1, 2005
23.617
+0.423
1.82%
jan 1, 2006
22.64
-0.977
-4.14%
jan 1, 2007
23.72
+1.08
4.77%
jan 1, 2008
23.487
-0.233
-0.98%
jan 1, 2009
22.677
-0.811
-3.45%
jan 1, 2010
22.076
-0.6
-2.65%
jan 1, 2011
22.017
-0.059
-0.27%
jan 1, 2012
21.366
-0.651
-2.96%
jan 1, 2013
19.94
-1.426
-6.67%
jan 1, 2014
17.978
-1.962
-9.84%
jan 1, 2015
11.263
-6.715
-37.35%
Ranking of countries by current statistics by years


Comments: