29
/
en
AIzaSyAYiBZKx7MnpbEhh9jyipgxe19OcubqV5w
April 1, 2024
37680
IDA & IBRD total
IBT
false
2
1
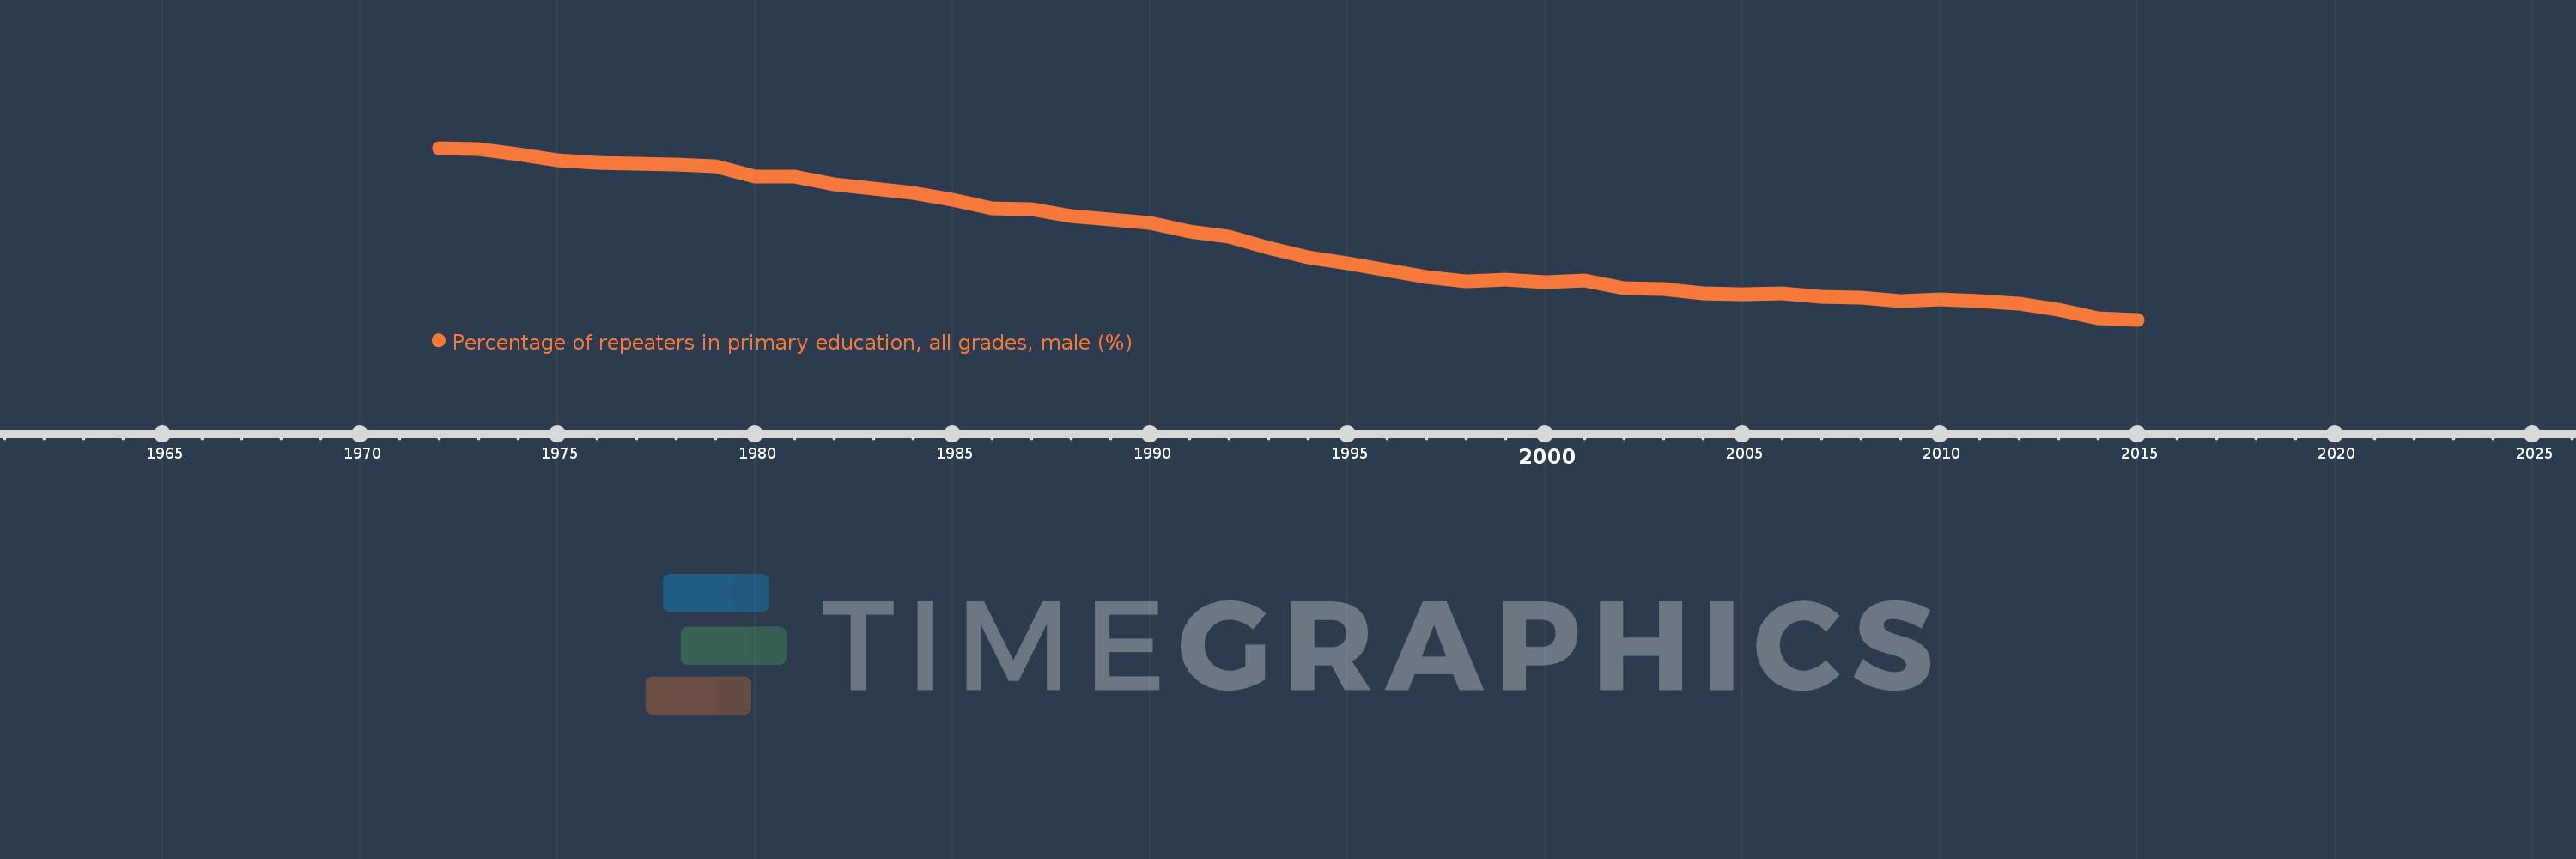
Percentage of repeaters in primary education, all grades, male (%)
2015,2014,2013,2012,2011,2010,2009,2008,2007,2006,2005,2004,2003,2002,2001,2000,1999,1998,1997,1996,1995,1994,1993,1992,1991,1990,1989,1988,1987,1986,1985,1984,1983,1982,1981,1980,1979,1978,1977,1976,1975,1974,1973,1972
This statistics in other country:
AfghanistanAlbaniaAlgeriaAndorraAngolaAntigua and BarbudaArab WorldArgentinaArmeniaArubaAustriaAzerbaijanBahamas, TheBahrainBangladeshBelarusBelgiumBelizeBeninBermudaBhutanBoliviaBosnia and HerzegovinaBotswanaBrazilBritish Virgin IslandsBrunei DarussalamBulgariaBurkina FasoBurundiCabo VerdeCambodiaCameroonCanadaCaribbean small statesCayman IslandsCentral African RepublicCentral Europe and the BalticsChadChileChinaColombiaComorosCongo, Dem. Rep.Congo, Rep.Costa RicaCote d'IvoireCroatiaCubaCyprusCzech RepublicDenmarkDjiboutiDominicaDominican RepublicEarly-demographic dividendEast Asia & PacificEast Asia & Pacific (excluding high income)East Asia & Pacific (IDA & IBRD countries)EcuadorEgypt, Arab Rep.El SalvadorEquatorial GuineaEritreaEstoniaEthiopiaEuro areaEurope & Central AsiaEurope & Central Asia (excluding high income)Europe & Central Asia (IDA & IBRD countries)European UnionFijiFinlandFragile and conflict affected situationsFranceGabonGambia, TheGeorgiaGermanyGhanaGreeceGrenadaGuatemalaGuineaGuinea-BissauGuyanaHaitiHeavily indebted poor countries (HIPC)High incomeHondurasHong Kong SAR, ChinaHungaryIBRD onlyIcelandIDA & IBRD totalIDA blendIDA onlyIDA totalIndiaIndonesiaIran, Islamic Rep.IraqIrelandIsraelItalyJamaicaJapanJordanKazakhstanKenyaKiribatiKorea, Rep.KuwaitKyrgyz RepublicLao PDRLate-demographic dividendLatin America & Caribbean Latin America & Caribbean (excluding high income)Latin America & the Caribbean (IDA & IBRD countries)LatviaLeast developed countries: UN classificationLebanonLesothoLiberiaLibyaLiechtensteinLithuaniaLow & middle incomeLow incomeLower middle incomeLuxembourgMacao SAR, ChinaMacedonia, FYRMadagascarMalawiMalaysiaMaldivesMaliMaltaMauritaniaMauritiusMexicoMiddle East & North AfricaMiddle East & North Africa (excluding high income)Middle East & North Africa (IDA & IBRD countries)Middle incomeMoldovaMonacoMongoliaMontenegroMoroccoMozambiqueMyanmarNamibiaNauruNepalNetherlandsNew ZealandNicaraguaNigerNorwayOECD membersOmanOther small statesPacific island small statesPakistanPalauPanamaPapua New GuineaParaguayPeruPhilippinesPolandPortugalPost-demographic dividendPre-demographic dividendQatarRomaniaRussian FederationRwandaSamoaSan MarinoSao Tome and PrincipeSaudi ArabiaSenegalSerbiaSeychellesSierra LeoneSingaporeSint Maarten (Dutch part)Slovak RepublicSloveniaSmall statesSolomon IslandsSomaliaSouth AfricaSouth AsiaSouth Asia (IDA & IBRD)South SudanSpainSri LankaSt. Kitts and NevisSt. LuciaSt. Vincent and the GrenadinesSub-Saharan Africa Sub-Saharan Africa (excluding high income)Sub-Saharan Africa (IDA & IBRD countries)SudanSurinameSwazilandSwedenSwitzerlandSyrian Arab RepublicTajikistanTanzaniaThailandTimor-LesteTogoTongaTrinidad and TobagoTunisiaTurkeyTurks and Caicos IslandsTuvaluUgandaUkraineUnited Arab EmiratesUnited KingdomUpper middle incomeUruguayUzbekistanVanuatuVenezuela, RBVietnamWest Bank and GazaWorldYemen, Rep.ZambiaZimbabwe Timeline:
This timeline shows a graph from 1972 to 2015 of IDA & IBRD total. No data until 1971. Number of actual observations by date: 44.
Source name:
World Development Indicators
Source organization:
UNESCO Institute for Statistics
Categories, topics:
Education, Gender
Last updated:
apr 23, 2017
Indicators value changes by year
Maximum:
13.188
jan 1, 1972
At the date of observation
Value
Absolute change
Change from previous value
jan 1, 1972
13.188
+13.188
0.0%
jan 1, 1973
13.143
-0.045
-0.34%
jan 1, 1974
12.833
-0.309
-2.35%
jan 1, 1975
12.508
-0.325
-2.53%
jan 1, 1976
12.385
-0.123
-0.98%
jan 1, 1977
12.362
-0.023
-0.19%
jan 1, 1978
12.273
-0.089
-0.72%
jan 1, 1979
12.192
-0.081
-0.66%
jan 1, 1980
11.629
-0.564
-4.62%
jan 1, 1981
11.668
+0.039
0.34%
jan 1, 1982
11.222
-0.446
-3.82%
jan 1, 1983
11.018
-0.204
-1.82%
jan 1, 1984
10.768
-0.25
-2.27%
jan 1, 1985
10.373
-0.396
-3.67%
jan 1, 1986
9.913
-0.459
-4.43%
jan 1, 1987
9.893
-0.02
-0.2%
jan 1, 1988
9.508
-0.385
-3.89%
jan 1, 1989
9.317
-0.191
-2.01%
jan 1, 1990
9.13
-0.187
-2.0%
jan 1, 1991
8.673
-0.457
-5.0%
jan 1, 1992
8.402
-0.271
-3.12%
jan 1, 1993
7.781
-0.621
-7.39%
jan 1, 1994
7.304
-0.477
-6.13%
jan 1, 1995
6.974
-0.33
-4.52%
jan 1, 1996
6.609
-0.365
-5.24%
jan 1, 1997
6.242
-0.367
-5.55%
jan 1, 1998
6.005
-0.237
-3.8%
jan 1, 1999
6.068
+0.063
1.05%
jan 1, 2000
5.971
-0.097
-1.6%
jan 1, 2001
6.037
+0.067
1.12%
jan 1, 2002
5.61
-0.428
-7.09%
jan 1, 2003
5.56
-0.049
-0.88%
jan 1, 2004
5.367
-0.193
-3.47%
jan 1, 2005
5.314
-0.053
-0.99%
jan 1, 2006
5.329
+0.015
0.28%
jan 1, 2007
5.176
-0.153
-2.87%
jan 1, 2008
5.14
-0.036
-0.7%
jan 1, 2009
4.919
-0.22
-4.29%
jan 1, 2010
5.012
+0.093
1.89%
jan 1, 2011
4.917
-0.095
-1.9%
jan 1, 2012
4.771
-0.147
-2.98%
jan 1, 2013
4.472
-0.298
-6.25%
jan 1, 2014
4.013
-0.459
-10.27%
jan 1, 2015
3.927
-0.086
-2.14%
Ranking of countries by current statistics by years


Comments: