29
/
en
AIzaSyAYiBZKx7MnpbEhh9jyipgxe19OcubqV5w
April 1, 2024
53256
Other small states
OSS
false
2
1
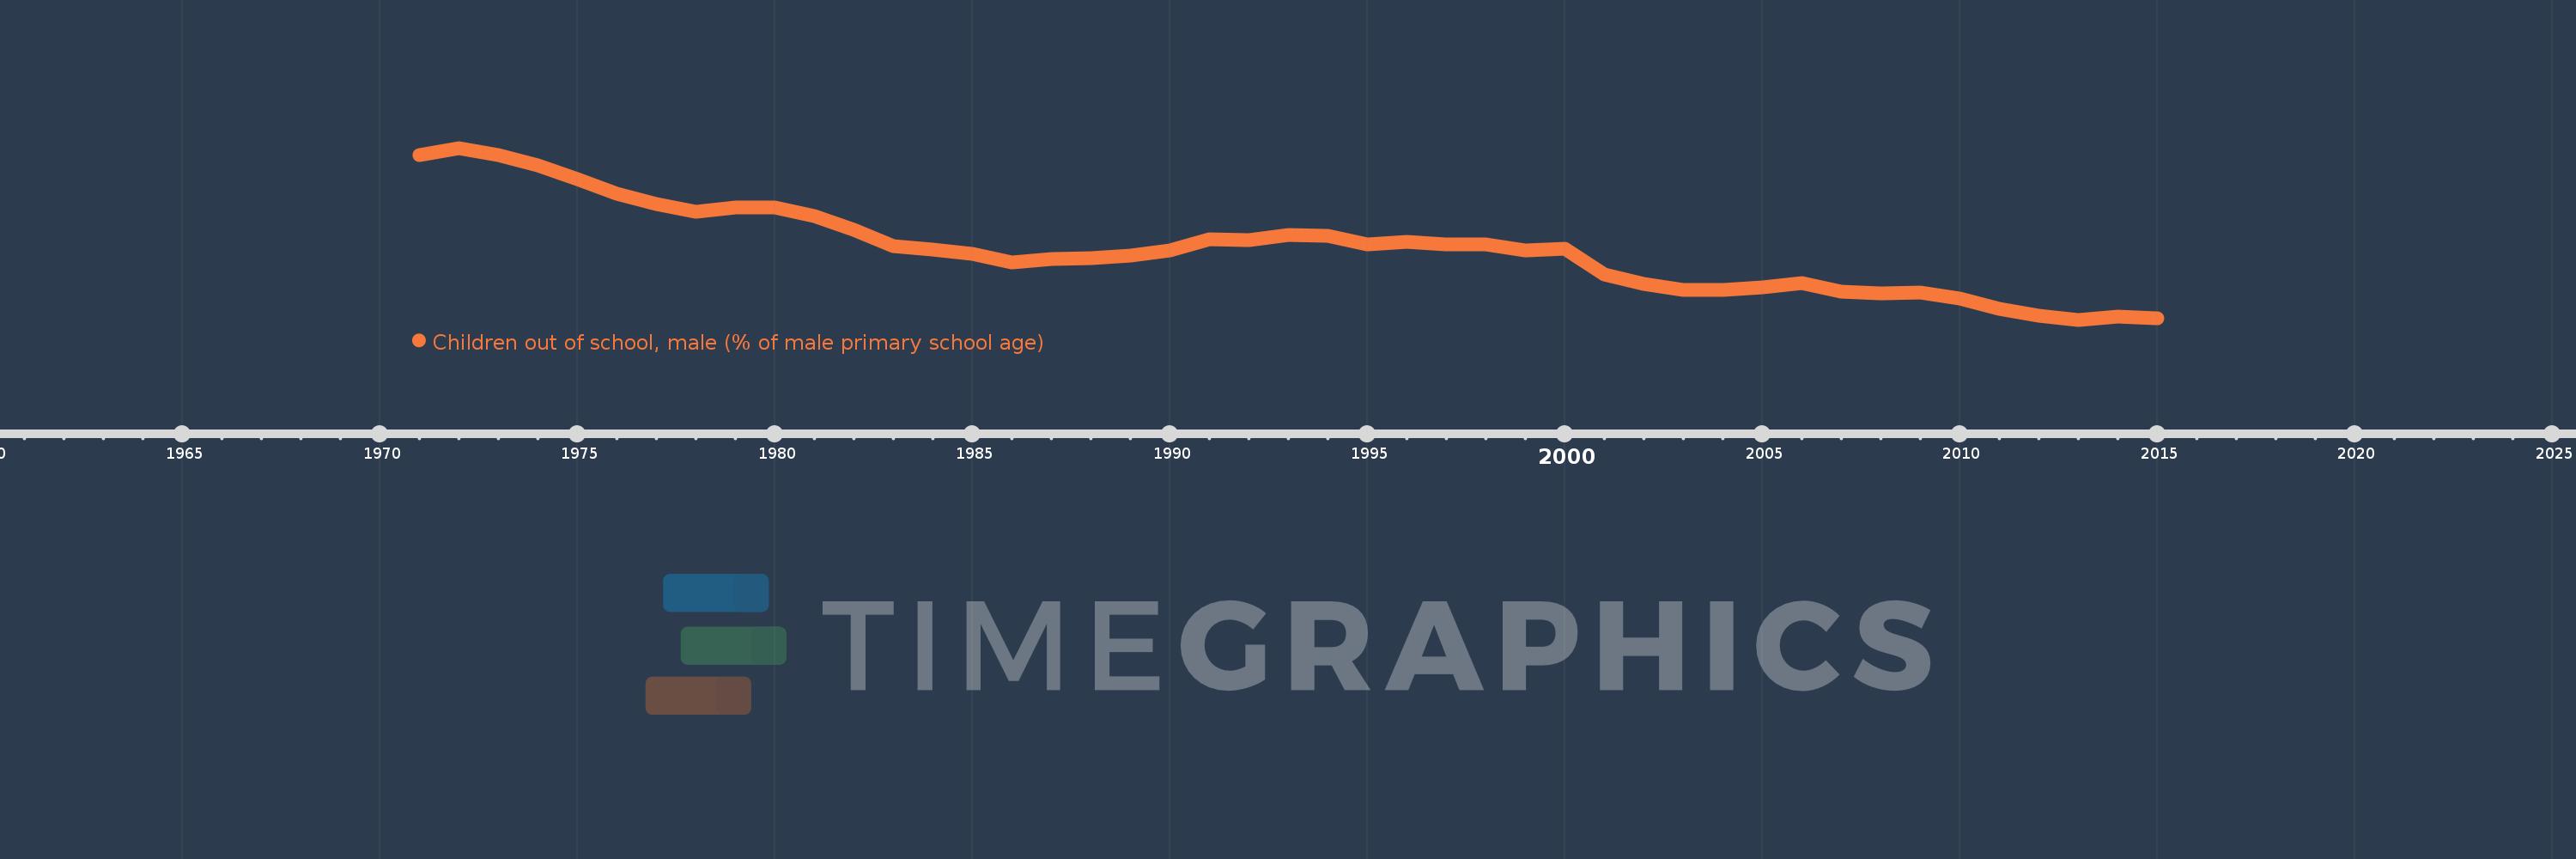
Children out of school, male (% of male primary school age)
2015,2014,2013,2012,2011,2010,2009,2008,2007,2006,2005,2004,2003,2002,2001,2000,1999,1998,1997,1996,1995,1994,1993,1992,1991,1990,1989,1988,1987,1986,1985,1984,1983,1982,1981,1980,1979,1978,1977,1976,1975,1974,1973,1972,1971
This statistics in other country:
AfghanistanAlbaniaAlgeriaAngolaAntigua and BarbudaArab WorldArgentinaArmeniaArubaAustraliaAustriaAzerbaijanBahamas, TheBahrainBangladeshBarbadosBelarusBelgiumBelizeBeninBermudaBhutanBoliviaBosnia and HerzegovinaBotswanaBrazilBrunei DarussalamBulgariaBurkina FasoBurundiCabo VerdeCambodiaCameroonCanadaCaribbean small statesCentral African RepublicCentral Europe and the BalticsChadChileChinaColombiaComorosCongo, Dem. Rep.Congo, Rep.Costa RicaCote d'IvoireCroatiaCubaCyprusDenmarkDjiboutiDominicaDominican RepublicEarly-demographic dividendEast Asia & PacificEast Asia & Pacific (excluding high income)East Asia & Pacific (IDA & IBRD countries)EcuadorEgypt, Arab Rep.El SalvadorEquatorial GuineaEritreaEstoniaEthiopiaEuro areaEurope & Central AsiaEurope & Central Asia (excluding high income)Europe & Central Asia (IDA & IBRD countries)European UnionFijiFinlandFragile and conflict affected situationsFranceGabonGambia, TheGeorgiaGhanaGreeceGrenadaGuatemalaGuineaGuinea-BissauGuyanaHaitiHeavily indebted poor countries (HIPC)High incomeHondurasHong Kong SAR, ChinaHungaryIBRD onlyIcelandIDA & IBRD totalIDA blendIDA onlyIDA totalIndiaIndonesiaIran, Islamic Rep.IraqIrelandIsraelItalyJamaicaJapanJordanKazakhstanKenyaKiribatiKorea, Dem. People’s Rep.Korea, Rep.KuwaitKyrgyz RepublicLao PDRLate-demographic dividendLatin America & Caribbean Latin America & Caribbean (excluding high income)Latin America & the Caribbean (IDA & IBRD countries)LatviaLeast developed countries: UN classificationLebanonLesothoLiberiaLibyaLiechtensteinLithuaniaLow & middle incomeLow incomeLower middle incomeLuxembourgMacao SAR, ChinaMacedonia, FYRMadagascarMalawiMaldivesMaliMaltaMarshall IslandsMauritaniaMauritiusMexicoMicronesia, Fed. Sts.Middle East & North AfricaMiddle East & North Africa (excluding high income)Middle East & North Africa (IDA & IBRD countries)Middle incomeMoldovaMongoliaMontenegroMoroccoMozambiqueMyanmarNamibiaNauruNepalNetherlandsNew ZealandNicaraguaNigerNigeriaNorth AmericaNorwayOECD membersOmanOther small statesPacific island small statesPakistanPanamaPapua New GuineaParaguayPeruPhilippinesPolandPortugalPost-demographic dividendPre-demographic dividendPuerto RicoQatarRomaniaRussian FederationRwandaSamoaSan MarinoSao Tome and PrincipeSaudi ArabiaSenegalSerbiaSeychellesSierra LeoneSloveniaSmall statesSolomon IslandsSomaliaSouth AfricaSouth AsiaSouth Asia (IDA & IBRD)South SudanSpainSri LankaSt. Kitts and NevisSt. LuciaSt. Vincent and the GrenadinesSub-Saharan Africa Sub-Saharan Africa (excluding high income)Sub-Saharan Africa (IDA & IBRD countries)SudanSurinameSwazilandSwedenSwitzerlandSyrian Arab RepublicTajikistanTanzaniaThailandTimor-LesteTogoTongaTrinidad and TobagoTunisiaTurkeyTuvaluUgandaUkraineUnited Arab EmiratesUnited KingdomUnited StatesUpper middle incomeUruguayUzbekistanVanuatuVenezuela, RBWest Bank and GazaWorldYemen, Rep.ZambiaZimbabwe Timeline:
This timeline shows a graph from 1971 to 2015 of Other small states. No data until 1970. Number of actual observations by date: 45.
Source name:
World Development Indicators
Source organization:
United Nations Educational, Scientific, and Cultural Organization (UNESCO) Institute for Statistics.
Categories, topics:
Education
Last updated:
apr 23, 2017
Indicators value changes by year
Minimum:
15.205
jan 1, 2013
At the date of observation
Value
Absolute change
Change from previous value
jan 1, 1971
34.07
+34.07
0.0%
jan 1, 1972
34.89
+0.82
2.41%
jan 1, 1973
34.027
-0.863
-2.47%
jan 1, 1974
32.89
-1.137
-3.34%
jan 1, 1975
31.324
-1.567
-4.76%
jan 1, 1976
29.608
-1.716
-5.48%
jan 1, 1977
28.417
-1.191
-4.02%
jan 1, 1978
27.567
-0.85
-2.99%
jan 1, 1979
28.024
+0.457
1.66%
jan 1, 1980
28.044
+0.02
0.07%
jan 1, 1981
27.052
-0.993
-3.54%
jan 1, 1982
25.558
-1.494
-5.52%
jan 1, 1983
23.683
-1.875
-7.34%
jan 1, 1984
23.223
-0.46
-1.94%
jan 1, 1985
22.763
-0.46
-1.98%
jan 1, 1986
21.797
-0.966
-4.24%
jan 1, 1987
22.147
+0.35
1.61%
jan 1, 1988
22.26
+0.113
0.51%
jan 1, 1989
22.519
+0.259
1.16%
jan 1, 1990
23.166
+0.648
2.88%
jan 1, 1991
24.456
+1.29
5.57%
jan 1, 1992
24.282
-0.175
-0.71%
jan 1, 1993
24.876
+0.595
2.45%
jan 1, 1994
24.828
-0.048
-0.19%
jan 1, 1995
23.875
-0.953
-3.84%
jan 1, 1996
24.09
+0.215
0.9%
jan 1, 1997
23.861
-0.229
-0.95%
jan 1, 1998
23.872
+0.011
0.05%
jan 1, 1999
23.169
-0.703
-2.95%
jan 1, 2000
23.323
+0.154
0.67%
jan 1, 2001
20.395
-2.928
-12.55%
jan 1, 2002
19.345
-1.05
-5.15%
jan 1, 2003
18.576
-0.77
-3.98%
jan 1, 2004
18.655
+0.08
0.43%
jan 1, 2005
18.916
+0.261
1.4%
jan 1, 2006
19.366
+0.45
2.38%
jan 1, 2007
18.451
-0.915
-4.72%
jan 1, 2008
18.224
-0.227
-1.23%
jan 1, 2009
18.325
+0.101
0.55%
jan 1, 2010
17.628
-0.697
-3.8%
jan 1, 2011
16.503
-1.126
-6.39%
jan 1, 2012
15.625
-0.878
-5.32%
jan 1, 2013
15.205
-0.42
-2.69%
jan 1, 2014
15.566
+0.361
2.37%
jan 1, 2015
15.407
-0.159
-1.02%
Ranking of countries by current statistics by years


Comments: