29
/
en
AIzaSyAYiBZKx7MnpbEhh9jyipgxe19OcubqV5w
April 1, 2024
44878
Low & middle income
LMY
false
2
1
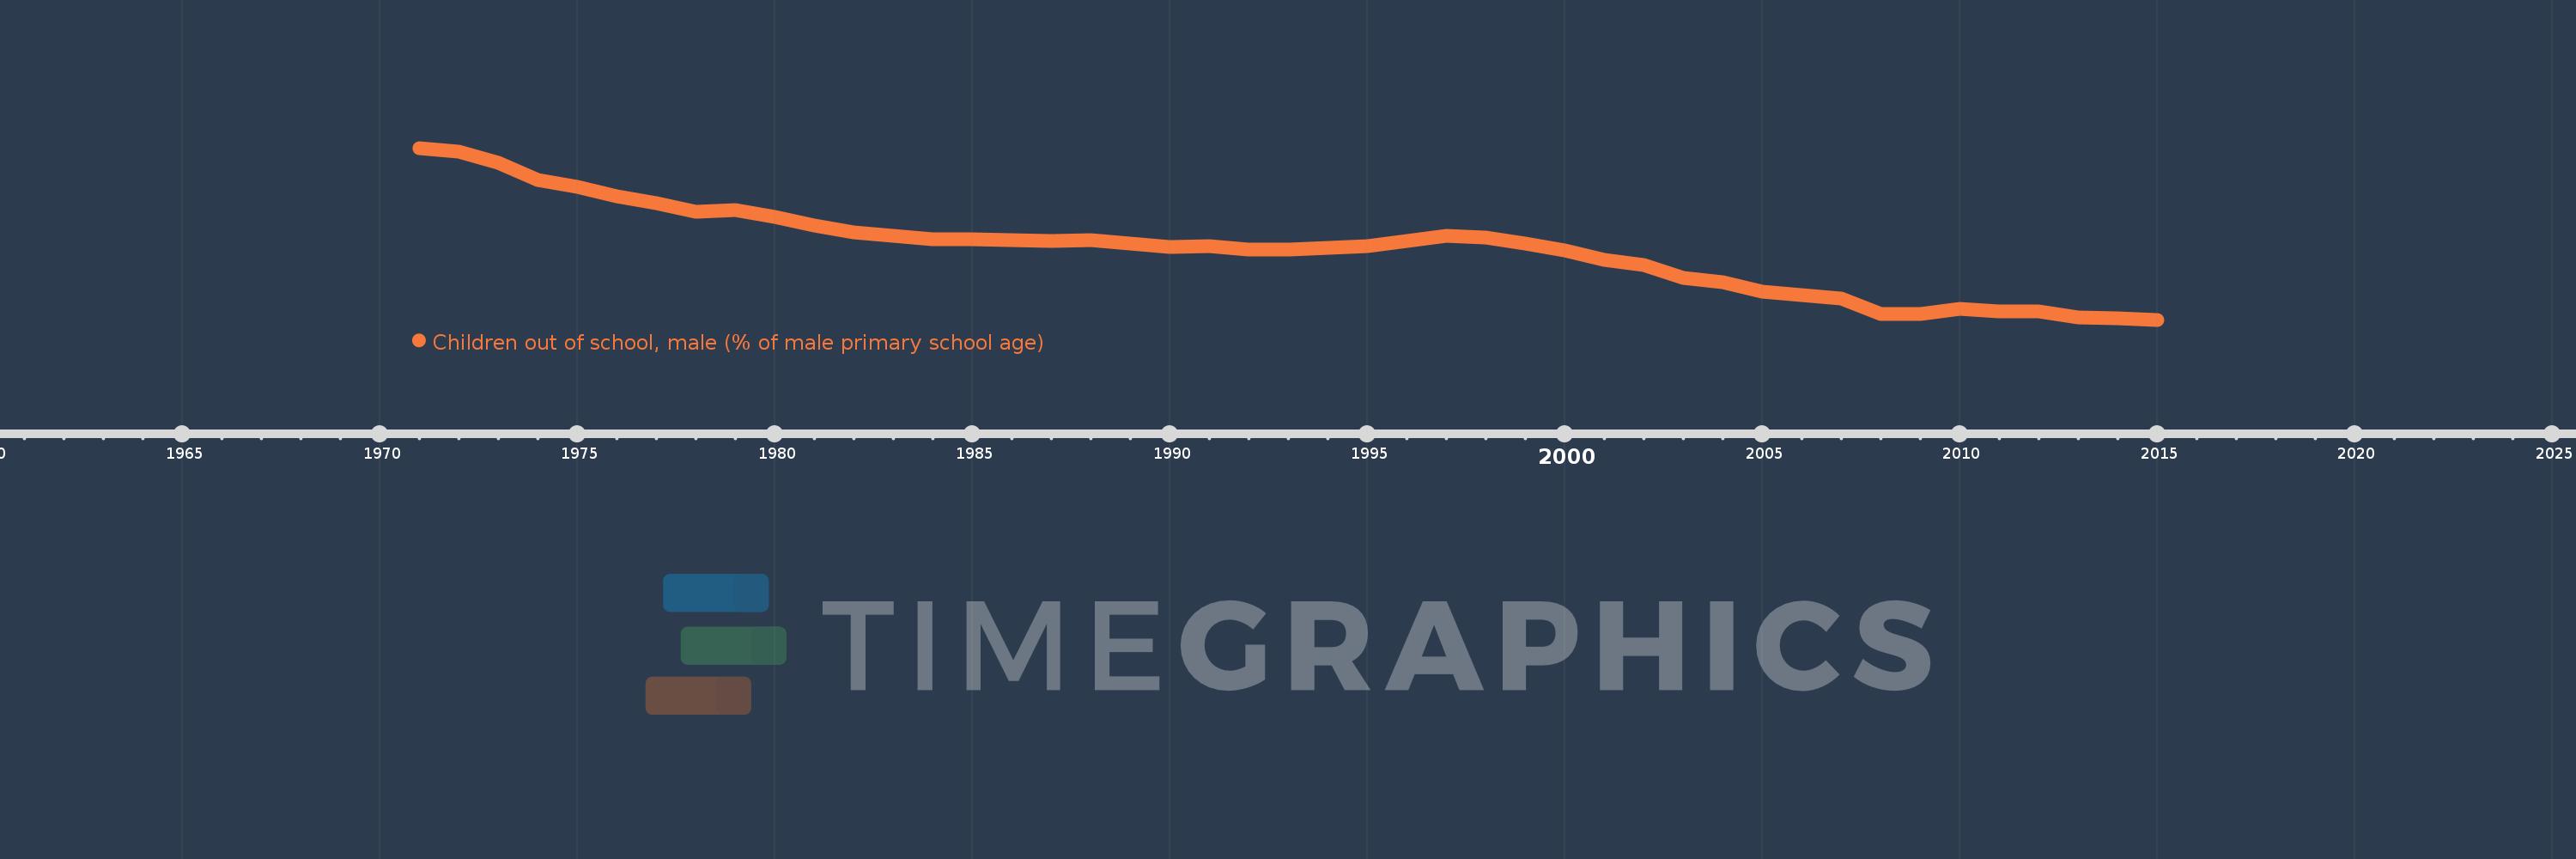
Children out of school, male (% of male primary school age)
2015,2014,2013,2012,2011,2010,2009,2008,2007,2006,2005,2004,2003,2002,2001,2000,1999,1998,1997,1996,1995,1994,1993,1992,1991,1990,1989,1988,1987,1986,1985,1984,1983,1982,1981,1980,1979,1978,1977,1976,1975,1974,1973,1972,1971
This statistics in other country:
AfghanistanAlbaniaAlgeriaAngolaAntigua and BarbudaArab WorldArgentinaArmeniaArubaAustraliaAustriaAzerbaijanBahamas, TheBahrainBangladeshBarbadosBelarusBelgiumBelizeBeninBermudaBhutanBoliviaBosnia and HerzegovinaBotswanaBrazilBrunei DarussalamBulgariaBurkina FasoBurundiCabo VerdeCambodiaCameroonCanadaCaribbean small statesCentral African RepublicCentral Europe and the BalticsChadChileChinaColombiaComorosCongo, Dem. Rep.Congo, Rep.Costa RicaCote d'IvoireCroatiaCubaCyprusDenmarkDjiboutiDominicaDominican RepublicEarly-demographic dividendEast Asia & PacificEast Asia & Pacific (excluding high income)East Asia & Pacific (IDA & IBRD countries)EcuadorEgypt, Arab Rep.El SalvadorEquatorial GuineaEritreaEstoniaEthiopiaEuro areaEurope & Central AsiaEurope & Central Asia (excluding high income)Europe & Central Asia (IDA & IBRD countries)European UnionFijiFinlandFragile and conflict affected situationsFranceGabonGambia, TheGeorgiaGhanaGreeceGrenadaGuatemalaGuineaGuinea-BissauGuyanaHaitiHeavily indebted poor countries (HIPC)High incomeHondurasHong Kong SAR, ChinaHungaryIBRD onlyIcelandIDA & IBRD totalIDA blendIDA onlyIDA totalIndiaIndonesiaIran, Islamic Rep.IraqIrelandIsraelItalyJamaicaJapanJordanKazakhstanKenyaKiribatiKorea, Dem. People’s Rep.Korea, Rep.KuwaitKyrgyz RepublicLao PDRLate-demographic dividendLatin America & Caribbean Latin America & Caribbean (excluding high income)Latin America & the Caribbean (IDA & IBRD countries)LatviaLeast developed countries: UN classificationLebanonLesothoLiberiaLibyaLiechtensteinLithuaniaLow & middle incomeLow incomeLower middle incomeLuxembourgMacao SAR, ChinaMacedonia, FYRMadagascarMalawiMaldivesMaliMaltaMarshall IslandsMauritaniaMauritiusMexicoMicronesia, Fed. Sts.Middle East & North AfricaMiddle East & North Africa (excluding high income)Middle East & North Africa (IDA & IBRD countries)Middle incomeMoldovaMongoliaMontenegroMoroccoMozambiqueMyanmarNamibiaNauruNepalNetherlandsNew ZealandNicaraguaNigerNigeriaNorth AmericaNorwayOECD membersOmanOther small statesPacific island small statesPakistanPanamaPapua New GuineaParaguayPeruPhilippinesPolandPortugalPost-demographic dividendPre-demographic dividendPuerto RicoQatarRomaniaRussian FederationRwandaSamoaSan MarinoSao Tome and PrincipeSaudi ArabiaSenegalSerbiaSeychellesSierra LeoneSloveniaSmall statesSolomon IslandsSomaliaSouth AfricaSouth AsiaSouth Asia (IDA & IBRD)South SudanSpainSri LankaSt. Kitts and NevisSt. LuciaSt. Vincent and the GrenadinesSub-Saharan Africa Sub-Saharan Africa (excluding high income)Sub-Saharan Africa (IDA & IBRD countries)SudanSurinameSwazilandSwedenSwitzerlandSyrian Arab RepublicTajikistanTanzaniaThailandTimor-LesteTogoTongaTrinidad and TobagoTunisiaTurkeyTuvaluUgandaUkraineUnited Arab EmiratesUnited KingdomUnited StatesUpper middle incomeUruguayUzbekistanVanuatuVenezuela, RBWest Bank and GazaWorldYemen, Rep.ZambiaZimbabwe Timeline:
This timeline shows a graph from 1971 to 2015 of Low & middle income. No data until 1970. Number of actual observations by date: 45.
Source name:
World Development Indicators
Source organization:
United Nations Educational, Scientific, and Cultural Organization (UNESCO) Institute for Statistics.
Categories, topics:
Education
Last updated:
apr 23, 2017
Indicators value changes by year
Maximum:
22.671
jan 1, 1971
At the date of observation
Value
Absolute change
Change from previous value
jan 1, 1971
22.671
+22.671
0.0%
jan 1, 1972
22.356
-0.315
-1.39%
jan 1, 1973
21.493
-0.863
-3.86%
jan 1, 1974
20.042
-1.451
-6.75%
jan 1, 1975
19.502
-0.539
-2.69%
jan 1, 1976
18.776
-0.726
-3.72%
jan 1, 1977
18.157
-0.62
-3.3%
jan 1, 1978
17.458
-0.699
-3.85%
jan 1, 1979
17.651
+0.193
1.1%
jan 1, 1980
17.044
-0.607
-3.44%
jan 1, 1981
16.344
-0.7
-4.11%
jan 1, 1982
15.787
-0.558
-3.41%
jan 1, 1983
15.511
-0.276
-1.75%
jan 1, 1984
15.266
-0.245
-1.58%
jan 1, 1985
15.227
-0.038
-0.25%
jan 1, 1986
15.189
-0.038
-0.25%
jan 1, 1987
15.094
-0.095
-0.63%
jan 1, 1988
15.163
+0.069
0.46%
jan 1, 1989
14.899
-0.264
-1.74%
jan 1, 1990
14.633
-0.266
-1.79%
jan 1, 1991
14.689
+0.056
0.38%
jan 1, 1992
14.43
-0.258
-1.76%
jan 1, 1993
14.436
+0.006
0.04%
jan 1, 1994
14.559
+0.123
0.85%
jan 1, 1995
14.692
+0.133
0.91%
jan 1, 1996
15.123
+0.431
2.94%
jan 1, 1997
15.551
+0.428
2.83%
jan 1, 1998
15.409
-0.142
-0.91%
jan 1, 1999
14.907
-0.502
-3.26%
jan 1, 2000
14.349
-0.559
-3.75%
jan 1, 2001
13.576
-0.772
-5.38%
jan 1, 2002
13.189
-0.387
-2.85%
jan 1, 2003
12.137
-1.052
-7.98%
jan 1, 2004
11.741
-0.396
-3.26%
jan 1, 2005
11.008
-0.733
-6.25%
jan 1, 2006
10.695
-0.313
-2.84%
jan 1, 2007
10.442
-0.253
-2.37%
jan 1, 2008
9.162
-1.28
-12.26%
jan 1, 2009
9.218
+0.056
0.61%
jan 1, 2010
9.614
+0.396
4.3%
jan 1, 2011
9.386
-0.228
-2.37%
jan 1, 2012
9.366
-0.021
-0.22%
jan 1, 2013
8.932
-0.433
-4.63%
jan 1, 2014
8.852
-0.08
-0.9%
jan 1, 2015
8.72
-0.132
-1.49%
Ranking of countries by current statistics by years


Comments: