29
/
en
AIzaSyAYiBZKx7MnpbEhh9jyipgxe19OcubqV5w
April 1, 2024
119670
Djibouti
DJI
true
2
1
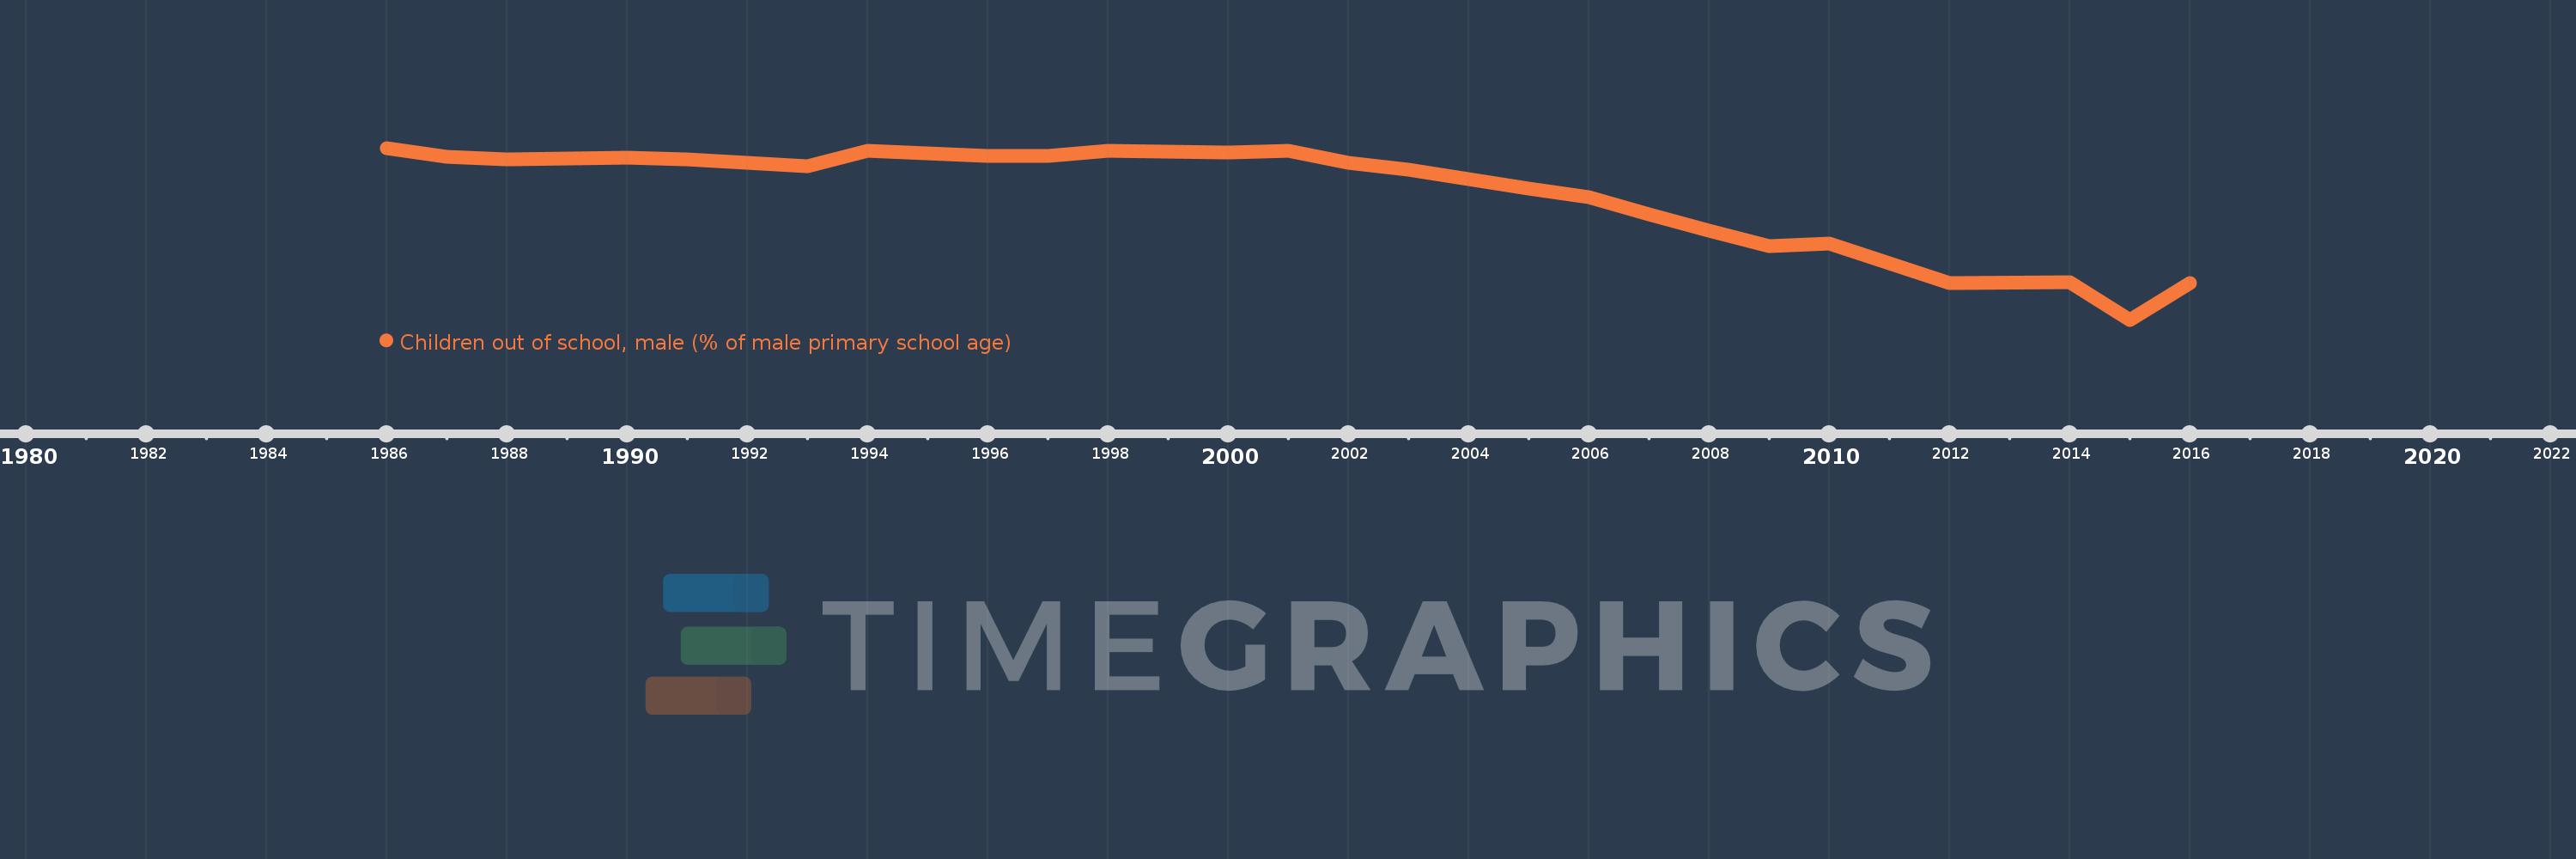
Children out of school, male (% of male primary school age)
2016,2015,2014,2012,2010,2009,2008,2007,2006,2005,2003,2002,2001,2000,1998,1997,1996,1995,1994,1993,1991,1990,1989,1988,1987,1986
This statistics in other country:
AfghanistanAlbaniaAlgeriaAngolaAntigua and BarbudaArab WorldArgentinaArmeniaArubaAustraliaAustriaAzerbaijanBahamas, TheBahrainBangladeshBarbadosBelarusBelgiumBelizeBeninBermudaBhutanBoliviaBosnia and HerzegovinaBotswanaBrazilBrunei DarussalamBulgariaBurkina FasoBurundiCabo VerdeCambodiaCameroonCanadaCaribbean small statesCentral African RepublicCentral Europe and the BalticsChadChileChinaColombiaComorosCongo, Dem. Rep.Congo, Rep.Costa RicaCote d'IvoireCroatiaCubaCyprusDenmarkDjiboutiDominicaDominican RepublicEarly-demographic dividendEast Asia & PacificEast Asia & Pacific (excluding high income)East Asia & Pacific (IDA & IBRD countries)EcuadorEgypt, Arab Rep.El SalvadorEquatorial GuineaEritreaEstoniaEthiopiaEuro areaEurope & Central AsiaEurope & Central Asia (excluding high income)Europe & Central Asia (IDA & IBRD countries)European UnionFijiFinlandFragile and conflict affected situationsFranceGabonGambia, TheGeorgiaGhanaGreeceGrenadaGuatemalaGuineaGuinea-BissauGuyanaHaitiHeavily indebted poor countries (HIPC)High incomeHondurasHong Kong SAR, ChinaHungaryIBRD onlyIcelandIDA & IBRD totalIDA blendIDA onlyIDA totalIndiaIndonesiaIran, Islamic Rep.IraqIrelandIsraelItalyJamaicaJapanJordanKazakhstanKenyaKiribatiKorea, Dem. People’s Rep.Korea, Rep.KuwaitKyrgyz RepublicLao PDRLate-demographic dividendLatin America & Caribbean Latin America & Caribbean (excluding high income)Latin America & the Caribbean (IDA & IBRD countries)LatviaLeast developed countries: UN classificationLebanonLesothoLiberiaLibyaLiechtensteinLithuaniaLow & middle incomeLow incomeLower middle incomeLuxembourgMacao SAR, ChinaMacedonia, FYRMadagascarMalawiMaldivesMaliMaltaMarshall IslandsMauritaniaMauritiusMexicoMicronesia, Fed. Sts.Middle East & North AfricaMiddle East & North Africa (excluding high income)Middle East & North Africa (IDA & IBRD countries)Middle incomeMoldovaMongoliaMontenegroMoroccoMozambiqueMyanmarNamibiaNauruNepalNetherlandsNew ZealandNicaraguaNigerNigeriaNorth AmericaNorwayOECD membersOmanOther small statesPacific island small statesPakistanPanamaPapua New GuineaParaguayPeruPhilippinesPolandPortugalPost-demographic dividendPre-demographic dividendPuerto RicoQatarRomaniaRussian FederationRwandaSamoaSan MarinoSao Tome and PrincipeSaudi ArabiaSenegalSerbiaSeychellesSierra LeoneSloveniaSmall statesSolomon IslandsSomaliaSouth AfricaSouth AsiaSouth Asia (IDA & IBRD)South SudanSpainSri LankaSt. Kitts and NevisSt. LuciaSt. Vincent and the GrenadinesSub-Saharan Africa Sub-Saharan Africa (excluding high income)Sub-Saharan Africa (IDA & IBRD countries)SudanSurinameSwazilandSwedenSwitzerlandSyrian Arab RepublicTajikistanTanzaniaThailandTimor-LesteTogoTongaTrinidad and TobagoTunisiaTurkeyTuvaluUgandaUkraineUnited Arab EmiratesUnited KingdomUnited StatesUpper middle incomeUruguayUzbekistanVanuatuVenezuela, RBWest Bank and GazaWorldYemen, Rep.ZambiaZimbabwe Timeline:
This timeline shows a graph from 1986 to 2016 of Djibouti. No data until 1985. Number of actual observations by date: 26.
Source name:
World Development Indicators
Source organization:
United Nations Educational, Scientific, and Cultural Organization (UNESCO) Institute for Statistics.
Categories, topics:
Education
Last updated:
apr 23, 2017
Indicators value changes by year
Minimum:
30.735
jan 1, 2015
Maximum:
71.374
jan 1, 1986
At the date of observation
Value
Absolute change
Change from previous value
jan 1, 1986
71.374
+71.374
0.0%
jan 1, 1987
69.207
-2.167
-3.04%
jan 1, 1988
68.668
-0.539
-0.78%
jan 1, 1989
68.89
+0.222
0.32%
jan 1, 1990
69.059
+0.169
0.24%
jan 1, 1991
68.744
-0.315
-0.46%
jan 1, 1993
67.067
-1.677
-2.44%
jan 1, 1994
70.612
+3.545
5.29%
jan 1, 1995
70.103
-0.509
-0.72%
jan 1, 1996
69.466
-0.637
-0.91%
jan 1, 1997
69.41
-0.057
-0.08%
jan 1, 1998
70.701
+1.291
1.86%
jan 1, 2000
70.322
-0.379
-0.54%
jan 1, 2001
70.675
+0.353
0.5%
jan 1, 2002
67.897
-2.778
-3.93%
jan 1, 2003
66.213
-1.684
-2.48%
jan 1, 2005
61.664
-4.549
-6.87%
jan 1, 2006
59.672
-1.992
-3.23%
jan 1, 2007
55.595
-4.077
-6.83%
jan 1, 2008
51.816
-3.779
-6.8%
jan 1, 2009
48.153
-3.664
-7.07%
jan 1, 2010
48.833
+0.68
1.41%
jan 1, 2012
39.331
-9.502
-19.46%
jan 1, 2014
39.661
+0.33
0.84%
jan 1, 2015
30.735
-8.926
-22.51%
jan 1, 2016
39.323
+8.588
27.94%
Ranking of countries by current statistics by years


Comments: