30
/
AIzaSyAYiBZKx7MnpbEhh9jyipgxe19OcubqV5w
April 1, 2024
227213
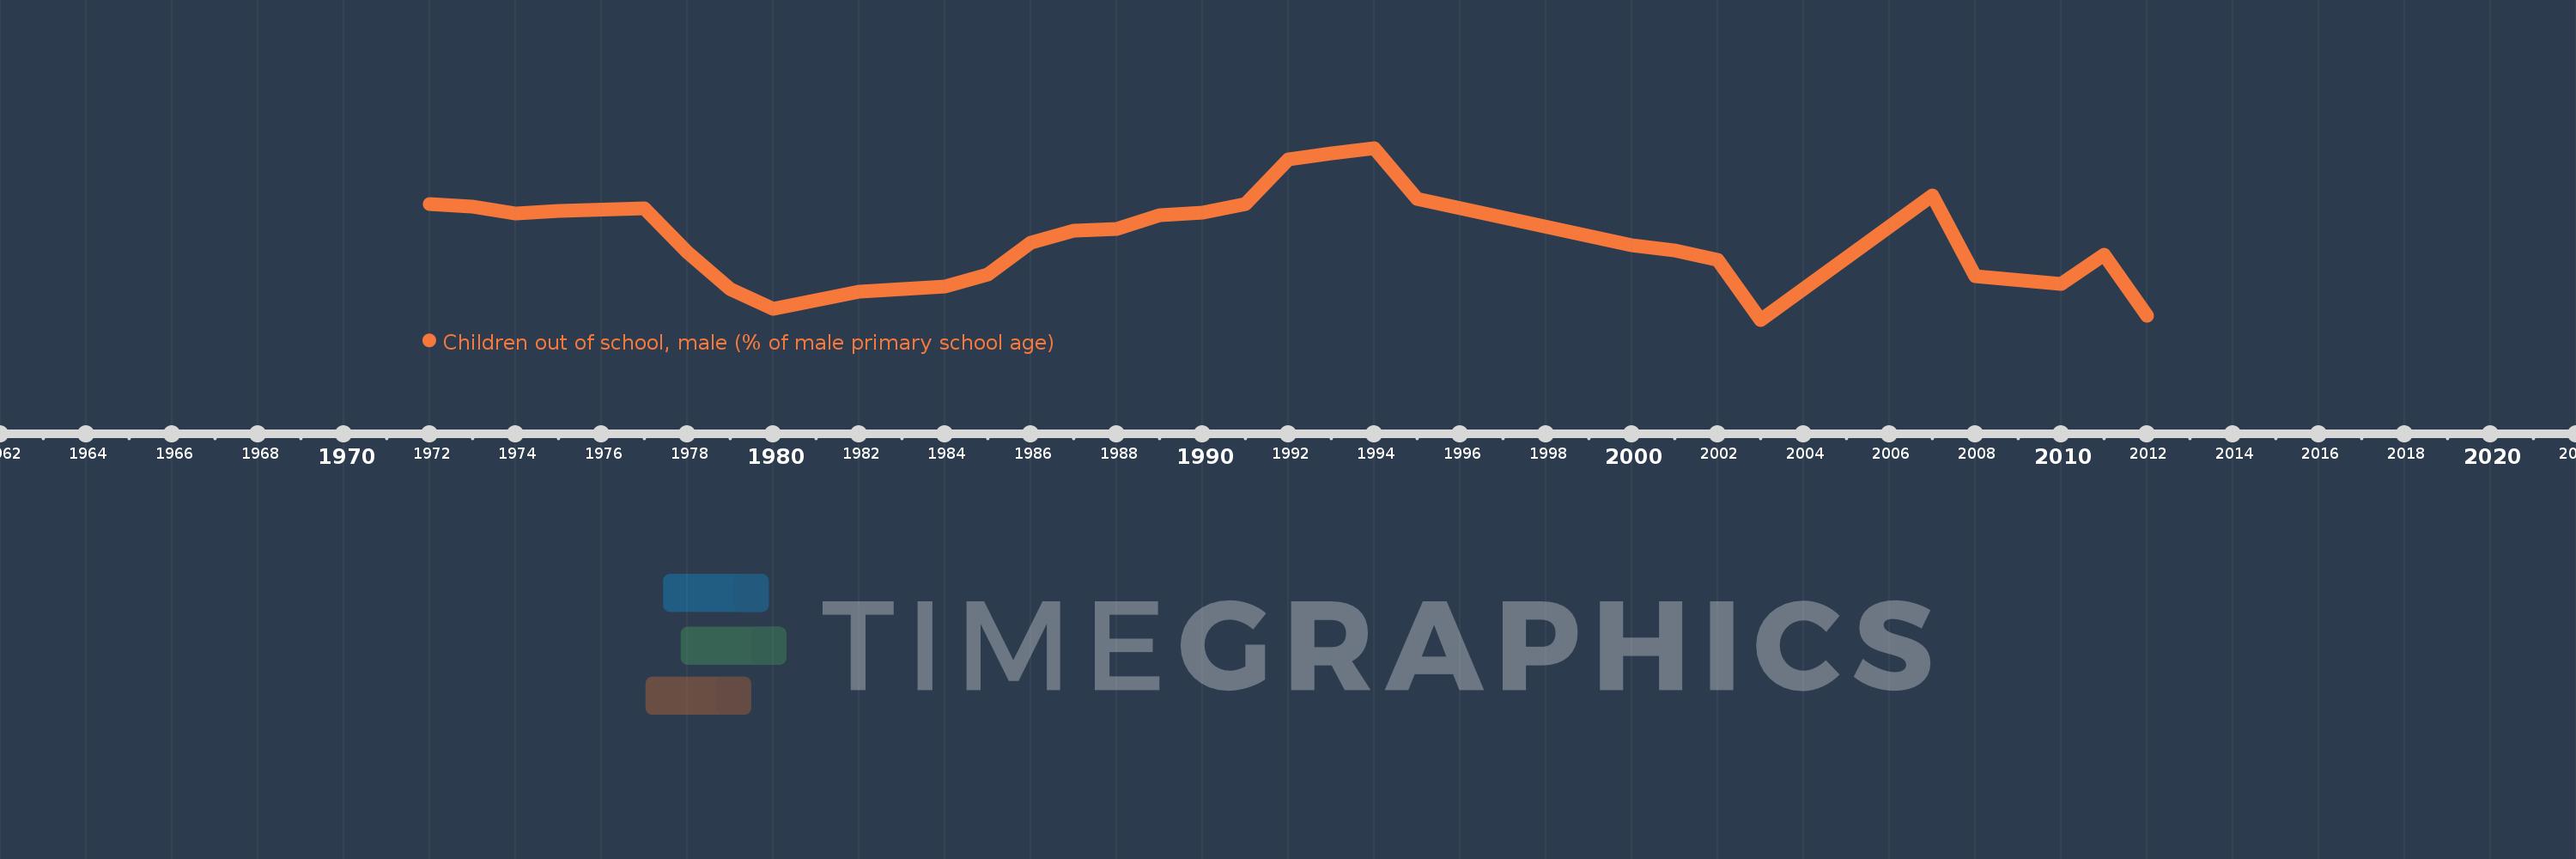
Qatar
QAT
true
2
1
Children out of school, male (% of male primary school age)
2012,2011,2010,2008,2007,2003,2002,2001,2000,1995,1994,1993,1992,1991,1990,1989,1988,1987,1986,1985,1984,1982,1980,1979,1978,1977,1975,1974,1973,1972
