29
/
en
AIzaSyAYiBZKx7MnpbEhh9jyipgxe19OcubqV5w
April 1, 2024
38790
IDA only
IDX
false
2
1
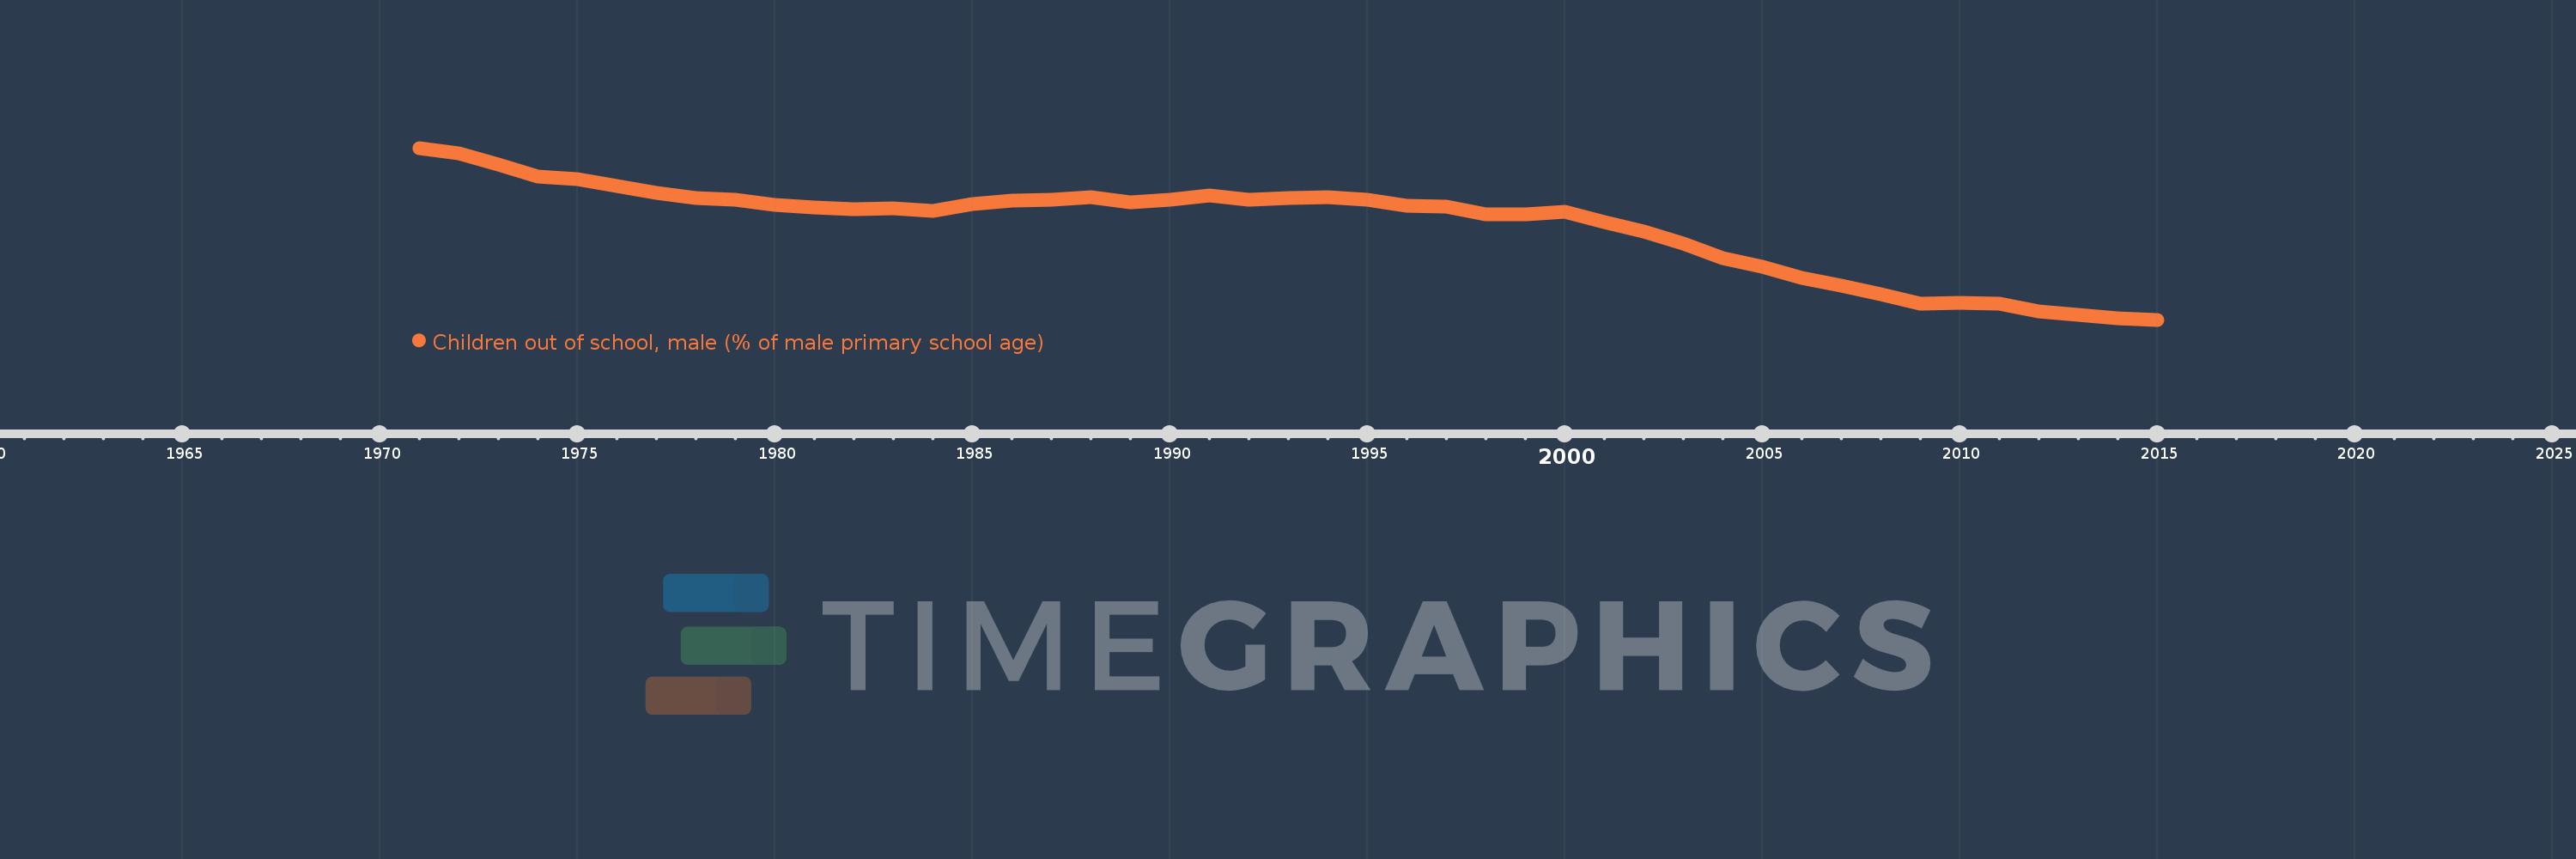
Children out of school, male (% of male primary school age)
2015,2014,2013,2012,2011,2010,2009,2008,2007,2006,2005,2004,2003,2002,2001,2000,1999,1998,1997,1996,1995,1994,1993,1992,1991,1990,1989,1988,1987,1986,1985,1984,1983,1982,1981,1980,1979,1978,1977,1976,1975,1974,1973,1972,1971
This statistics in other country:
AfghanistanAlbaniaAlgeriaAngolaAntigua and BarbudaArab WorldArgentinaArmeniaArubaAustraliaAustriaAzerbaijanBahamas, TheBahrainBangladeshBarbadosBelarusBelgiumBelizeBeninBermudaBhutanBoliviaBosnia and HerzegovinaBotswanaBrazilBrunei DarussalamBulgariaBurkina FasoBurundiCabo VerdeCambodiaCameroonCanadaCaribbean small statesCentral African RepublicCentral Europe and the BalticsChadChileChinaColombiaComorosCongo, Dem. Rep.Congo, Rep.Costa RicaCote d'IvoireCroatiaCubaCyprusDenmarkDjiboutiDominicaDominican RepublicEarly-demographic dividendEast Asia & PacificEast Asia & Pacific (excluding high income)East Asia & Pacific (IDA & IBRD countries)EcuadorEgypt, Arab Rep.El SalvadorEquatorial GuineaEritreaEstoniaEthiopiaEuro areaEurope & Central AsiaEurope & Central Asia (excluding high income)Europe & Central Asia (IDA & IBRD countries)European UnionFijiFinlandFragile and conflict affected situationsFranceGabonGambia, TheGeorgiaGhanaGreeceGrenadaGuatemalaGuineaGuinea-BissauGuyanaHaitiHeavily indebted poor countries (HIPC)High incomeHondurasHong Kong SAR, ChinaHungaryIBRD onlyIcelandIDA & IBRD totalIDA blendIDA onlyIDA totalIndiaIndonesiaIran, Islamic Rep.IraqIrelandIsraelItalyJamaicaJapanJordanKazakhstanKenyaKiribatiKorea, Dem. People’s Rep.Korea, Rep.KuwaitKyrgyz RepublicLao PDRLate-demographic dividendLatin America & Caribbean Latin America & Caribbean (excluding high income)Latin America & the Caribbean (IDA & IBRD countries)LatviaLeast developed countries: UN classificationLebanonLesothoLiberiaLibyaLiechtensteinLithuaniaLow & middle incomeLow incomeLower middle incomeLuxembourgMacao SAR, ChinaMacedonia, FYRMadagascarMalawiMaldivesMaliMaltaMarshall IslandsMauritaniaMauritiusMexicoMicronesia, Fed. Sts.Middle East & North AfricaMiddle East & North Africa (excluding high income)Middle East & North Africa (IDA & IBRD countries)Middle incomeMoldovaMongoliaMontenegroMoroccoMozambiqueMyanmarNamibiaNauruNepalNetherlandsNew ZealandNicaraguaNigerNigeriaNorth AmericaNorwayOECD membersOmanOther small statesPacific island small statesPakistanPanamaPapua New GuineaParaguayPeruPhilippinesPolandPortugalPost-demographic dividendPre-demographic dividendPuerto RicoQatarRomaniaRussian FederationRwandaSamoaSan MarinoSao Tome and PrincipeSaudi ArabiaSenegalSerbiaSeychellesSierra LeoneSloveniaSmall statesSolomon IslandsSomaliaSouth AfricaSouth AsiaSouth Asia (IDA & IBRD)South SudanSpainSri LankaSt. Kitts and NevisSt. LuciaSt. Vincent and the GrenadinesSub-Saharan Africa Sub-Saharan Africa (excluding high income)Sub-Saharan Africa (IDA & IBRD countries)SudanSurinameSwazilandSwedenSwitzerlandSyrian Arab RepublicTajikistanTanzaniaThailandTimor-LesteTogoTongaTrinidad and TobagoTunisiaTurkeyTuvaluUgandaUkraineUnited Arab EmiratesUnited KingdomUnited StatesUpper middle incomeUruguayUzbekistanVanuatuVenezuela, RBWest Bank and GazaWorldYemen, Rep.ZambiaZimbabwe Timeline:
This timeline shows a graph from 1971 to 2015 of IDA only. No data until 1970. Number of actual observations by date: 45.
Source name:
World Development Indicators
Source organization:
United Nations Educational, Scientific, and Cultural Organization (UNESCO) Institute for Statistics.
Categories, topics:
Education
Last updated:
apr 23, 2017
Indicators value changes by year
Minimum:
15.682
jan 1, 2015
Maximum:
49.471
jan 1, 1971
At the date of observation
Value
Absolute change
Change from previous value
jan 1, 1971
49.471
+49.471
0.0%
jan 1, 1972
48.481
-0.99
-2.0%
jan 1, 1973
46.159
-2.323
-4.79%
jan 1, 1974
43.83
-2.328
-5.04%
jan 1, 1975
43.273
-0.557
-1.27%
jan 1, 1976
41.965
-1.309
-3.02%
jan 1, 1977
40.695
-1.27
-3.03%
jan 1, 1978
39.694
-1.001
-2.46%
jan 1, 1979
39.238
-0.456
-1.15%
jan 1, 1980
38.344
-0.894
-2.28%
jan 1, 1981
37.685
-0.659
-1.72%
jan 1, 1982
37.457
-0.228
-0.6%
jan 1, 1983
37.669
+0.211
0.56%
jan 1, 1984
37.13
-0.539
-1.43%
jan 1, 1985
38.4
+1.27
3.42%
jan 1, 1986
39.049
+0.649
1.69%
jan 1, 1987
39.358
+0.31
0.79%
jan 1, 1988
39.763
+0.404
1.03%
jan 1, 1989
38.749
-1.014
-2.55%
jan 1, 1990
39.278
+0.53
1.37%
jan 1, 1991
40.18
+0.901
2.29%
jan 1, 1992
39.225
-0.955
-2.38%
jan 1, 1993
39.576
+0.351
0.89%
jan 1, 1994
39.796
+0.22
0.56%
jan 1, 1995
39.303
-0.493
-1.24%
jan 1, 1996
38.152
-1.151
-2.93%
jan 1, 1997
38.007
-0.145
-0.38%
jan 1, 1998
36.493
-1.514
-3.98%
jan 1, 1999
36.4
-0.094
-0.26%
jan 1, 2000
36.99
+0.59
1.62%
jan 1, 2001
34.955
-2.035
-5.5%
jan 1, 2002
33.075
-1.88
-5.38%
jan 1, 2003
30.672
-2.403
-7.27%
jan 1, 2004
27.792
-2.88
-9.39%
jan 1, 2005
26.147
-1.644
-5.92%
jan 1, 2006
23.832
-2.316
-8.86%
jan 1, 2007
22.333
-1.499
-6.29%
jan 1, 2008
20.777
-1.556
-6.97%
jan 1, 2009
18.782
-1.995
-9.6%
jan 1, 2010
18.971
+0.189
1.01%
jan 1, 2011
18.813
-0.159
-0.84%
jan 1, 2012
17.29
-1.523
-8.1%
jan 1, 2013
16.671
-0.618
-3.58%
jan 1, 2014
15.953
-0.718
-4.31%
jan 1, 2015
15.682
-0.271
-1.7%
Ranking of countries by current statistics by years


Comments: