29
/
en
AIzaSyAYiBZKx7MnpbEhh9jyipgxe19OcubqV5w
April 1, 2024
47962
Middle East & North Africa
MEA
false
2
1
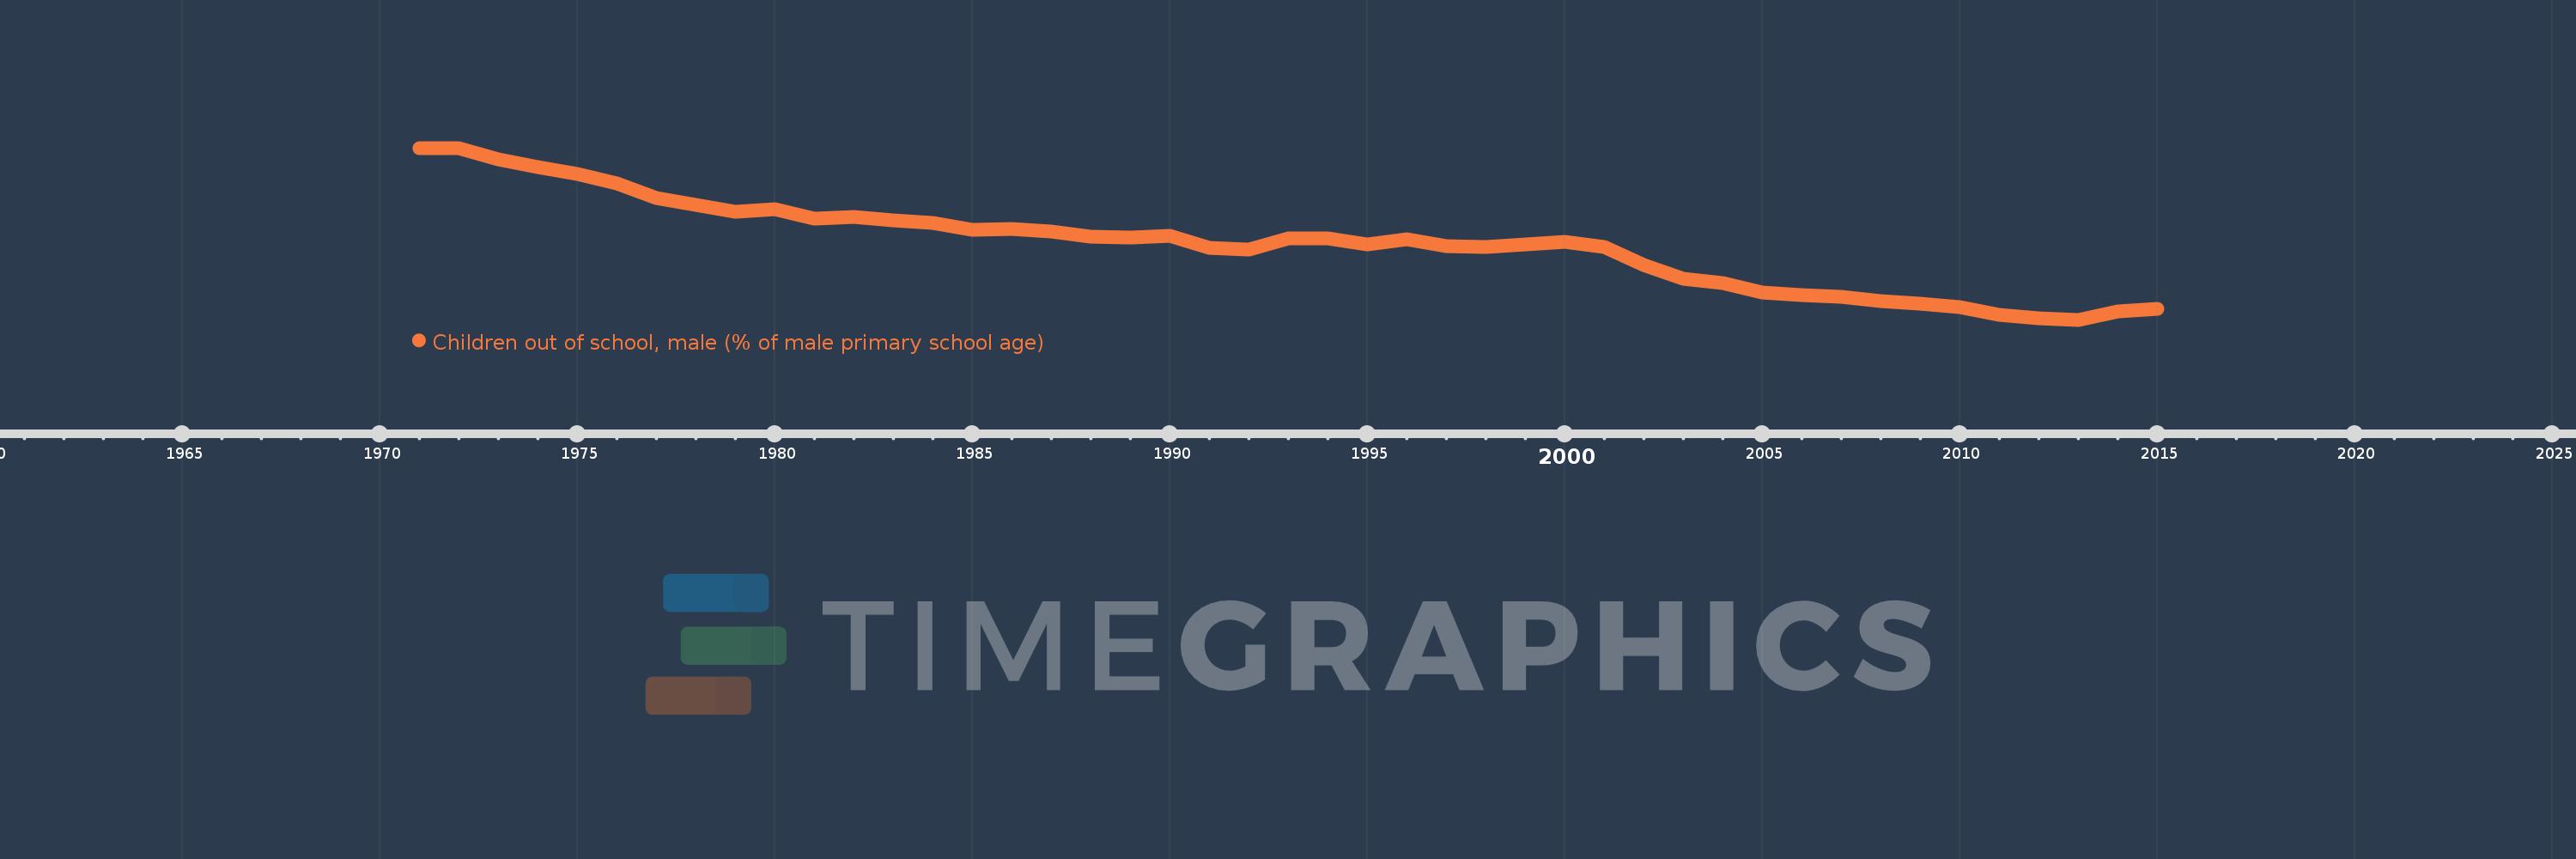
Children out of school, male (% of male primary school age)
2015,2014,2013,2012,2011,2010,2009,2008,2007,2006,2005,2004,2003,2002,2001,2000,1999,1998,1997,1996,1995,1994,1993,1992,1991,1990,1989,1988,1987,1986,1985,1984,1983,1982,1981,1980,1979,1978,1977,1976,1975,1974,1973,1972,1971
This statistics in other country:
AfghanistanAlbaniaAlgeriaAngolaAntigua and BarbudaArab WorldArgentinaArmeniaArubaAustraliaAustriaAzerbaijanBahamas, TheBahrainBangladeshBarbadosBelarusBelgiumBelizeBeninBermudaBhutanBoliviaBosnia and HerzegovinaBotswanaBrazilBrunei DarussalamBulgariaBurkina FasoBurundiCabo VerdeCambodiaCameroonCanadaCaribbean small statesCentral African RepublicCentral Europe and the BalticsChadChileChinaColombiaComorosCongo, Dem. Rep.Congo, Rep.Costa RicaCote d'IvoireCroatiaCubaCyprusDenmarkDjiboutiDominicaDominican RepublicEarly-demographic dividendEast Asia & PacificEast Asia & Pacific (excluding high income)East Asia & Pacific (IDA & IBRD countries)EcuadorEgypt, Arab Rep.El SalvadorEquatorial GuineaEritreaEstoniaEthiopiaEuro areaEurope & Central AsiaEurope & Central Asia (excluding high income)Europe & Central Asia (IDA & IBRD countries)European UnionFijiFinlandFragile and conflict affected situationsFranceGabonGambia, TheGeorgiaGhanaGreeceGrenadaGuatemalaGuineaGuinea-BissauGuyanaHaitiHeavily indebted poor countries (HIPC)High incomeHondurasHong Kong SAR, ChinaHungaryIBRD onlyIcelandIDA & IBRD totalIDA blendIDA onlyIDA totalIndiaIndonesiaIran, Islamic Rep.IraqIrelandIsraelItalyJamaicaJapanJordanKazakhstanKenyaKiribatiKorea, Dem. People’s Rep.Korea, Rep.KuwaitKyrgyz RepublicLao PDRLate-demographic dividendLatin America & Caribbean Latin America & Caribbean (excluding high income)Latin America & the Caribbean (IDA & IBRD countries)LatviaLeast developed countries: UN classificationLebanonLesothoLiberiaLibyaLiechtensteinLithuaniaLow & middle incomeLow incomeLower middle incomeLuxembourgMacao SAR, ChinaMacedonia, FYRMadagascarMalawiMaldivesMaliMaltaMarshall IslandsMauritaniaMauritiusMexicoMicronesia, Fed. Sts.Middle East & North AfricaMiddle East & North Africa (excluding high income)Middle East & North Africa (IDA & IBRD countries)Middle incomeMoldovaMongoliaMontenegroMoroccoMozambiqueMyanmarNamibiaNauruNepalNetherlandsNew ZealandNicaraguaNigerNigeriaNorth AmericaNorwayOECD membersOmanOther small statesPacific island small statesPakistanPanamaPapua New GuineaParaguayPeruPhilippinesPolandPortugalPost-demographic dividendPre-demographic dividendPuerto RicoQatarRomaniaRussian FederationRwandaSamoaSan MarinoSao Tome and PrincipeSaudi ArabiaSenegalSerbiaSeychellesSierra LeoneSloveniaSmall statesSolomon IslandsSomaliaSouth AfricaSouth AsiaSouth Asia (IDA & IBRD)South SudanSpainSri LankaSt. Kitts and NevisSt. LuciaSt. Vincent and the GrenadinesSub-Saharan Africa Sub-Saharan Africa (excluding high income)Sub-Saharan Africa (IDA & IBRD countries)SudanSurinameSwazilandSwedenSwitzerlandSyrian Arab RepublicTajikistanTanzaniaThailandTimor-LesteTogoTongaTrinidad and TobagoTunisiaTurkeyTuvaluUgandaUkraineUnited Arab EmiratesUnited KingdomUnited StatesUpper middle incomeUruguayUzbekistanVanuatuVenezuela, RBWest Bank and GazaWorldYemen, Rep.ZambiaZimbabwe Timeline:
This timeline shows a graph from 1971 to 2015 of Middle East & North Africa. No data until 1970. Number of actual observations by date: 45.
Source name:
World Development Indicators
Source organization:
United Nations Educational, Scientific, and Cultural Organization (UNESCO) Institute for Statistics.
Categories, topics:
Education
Last updated:
apr 23, 2017
Indicators value changes by year
Maximum:
25.039
jan 1, 1971
At the date of observation
Value
Absolute change
Change from previous value
jan 1, 1971
25.039
+25.039
0.0%
jan 1, 1972
25.037
-0.003
-0.01%
jan 1, 1973
23.53
-1.506
-6.02%
jan 1, 1974
22.572
-0.958
-4.07%
jan 1, 1975
21.699
-0.873
-3.87%
jan 1, 1976
20.401
-1.298
-5.98%
jan 1, 1977
18.569
-1.832
-8.98%
jan 1, 1978
17.584
-0.985
-5.31%
jan 1, 1979
16.737
-0.848
-4.82%
jan 1, 1980
17.018
+0.282
1.68%
jan 1, 1981
15.78
-1.239
-7.28%
jan 1, 1982
16.014
+0.234
1.48%
jan 1, 1983
15.553
-0.461
-2.88%
jan 1, 1984
15.296
-0.258
-1.66%
jan 1, 1985
14.405
-0.891
-5.82%
jan 1, 1986
14.505
+0.1
0.69%
jan 1, 1987
14.099
-0.406
-2.8%
jan 1, 1988
13.477
-0.622
-4.41%
jan 1, 1989
13.34
-0.137
-1.02%
jan 1, 1990
13.598
+0.258
1.93%
jan 1, 1991
12.074
-1.524
-11.21%
jan 1, 1992
11.768
-0.306
-2.53%
jan 1, 1993
13.211
+1.442
12.26%
jan 1, 1994
13.295
+0.084
0.64%
jan 1, 1995
12.429
-0.866
-6.52%
jan 1, 1996
13.103
+0.675
5.43%
jan 1, 1997
12.216
-0.888
-6.77%
jan 1, 1998
12.099
-0.117
-0.96%
jan 1, 1999
12.449
+0.35
2.89%
jan 1, 2000
12.77
+0.321
2.58%
jan 1, 2001
12.102
-0.668
-5.23%
jan 1, 2002
9.784
-2.317
-19.15%
jan 1, 2003
7.99
-1.794
-18.33%
jan 1, 2004
7.451
-0.539
-6.75%
jan 1, 2005
6.219
-1.231
-16.53%
jan 1, 2006
5.831
-0.388
-6.24%
jan 1, 2007
5.673
-0.158
-2.71%
jan 1, 2008
5.141
-0.532
-9.38%
jan 1, 2009
4.801
-0.34
-6.61%
jan 1, 2010
4.359
-0.442
-9.21%
jan 1, 2011
3.277
-1.081
-24.81%
jan 1, 2012
2.911
-0.367
-11.19%
jan 1, 2013
2.665
-0.245
-8.43%
jan 1, 2014
3.698
+1.032
38.73%
jan 1, 2015
4.094
+0.397
10.73%
Ranking of countries by current statistics by years


Comments: