29
/
en
AIzaSyAYiBZKx7MnpbEhh9jyipgxe19OcubqV5w
April 1, 2024
50701
Middle income
MIC
false
2
1
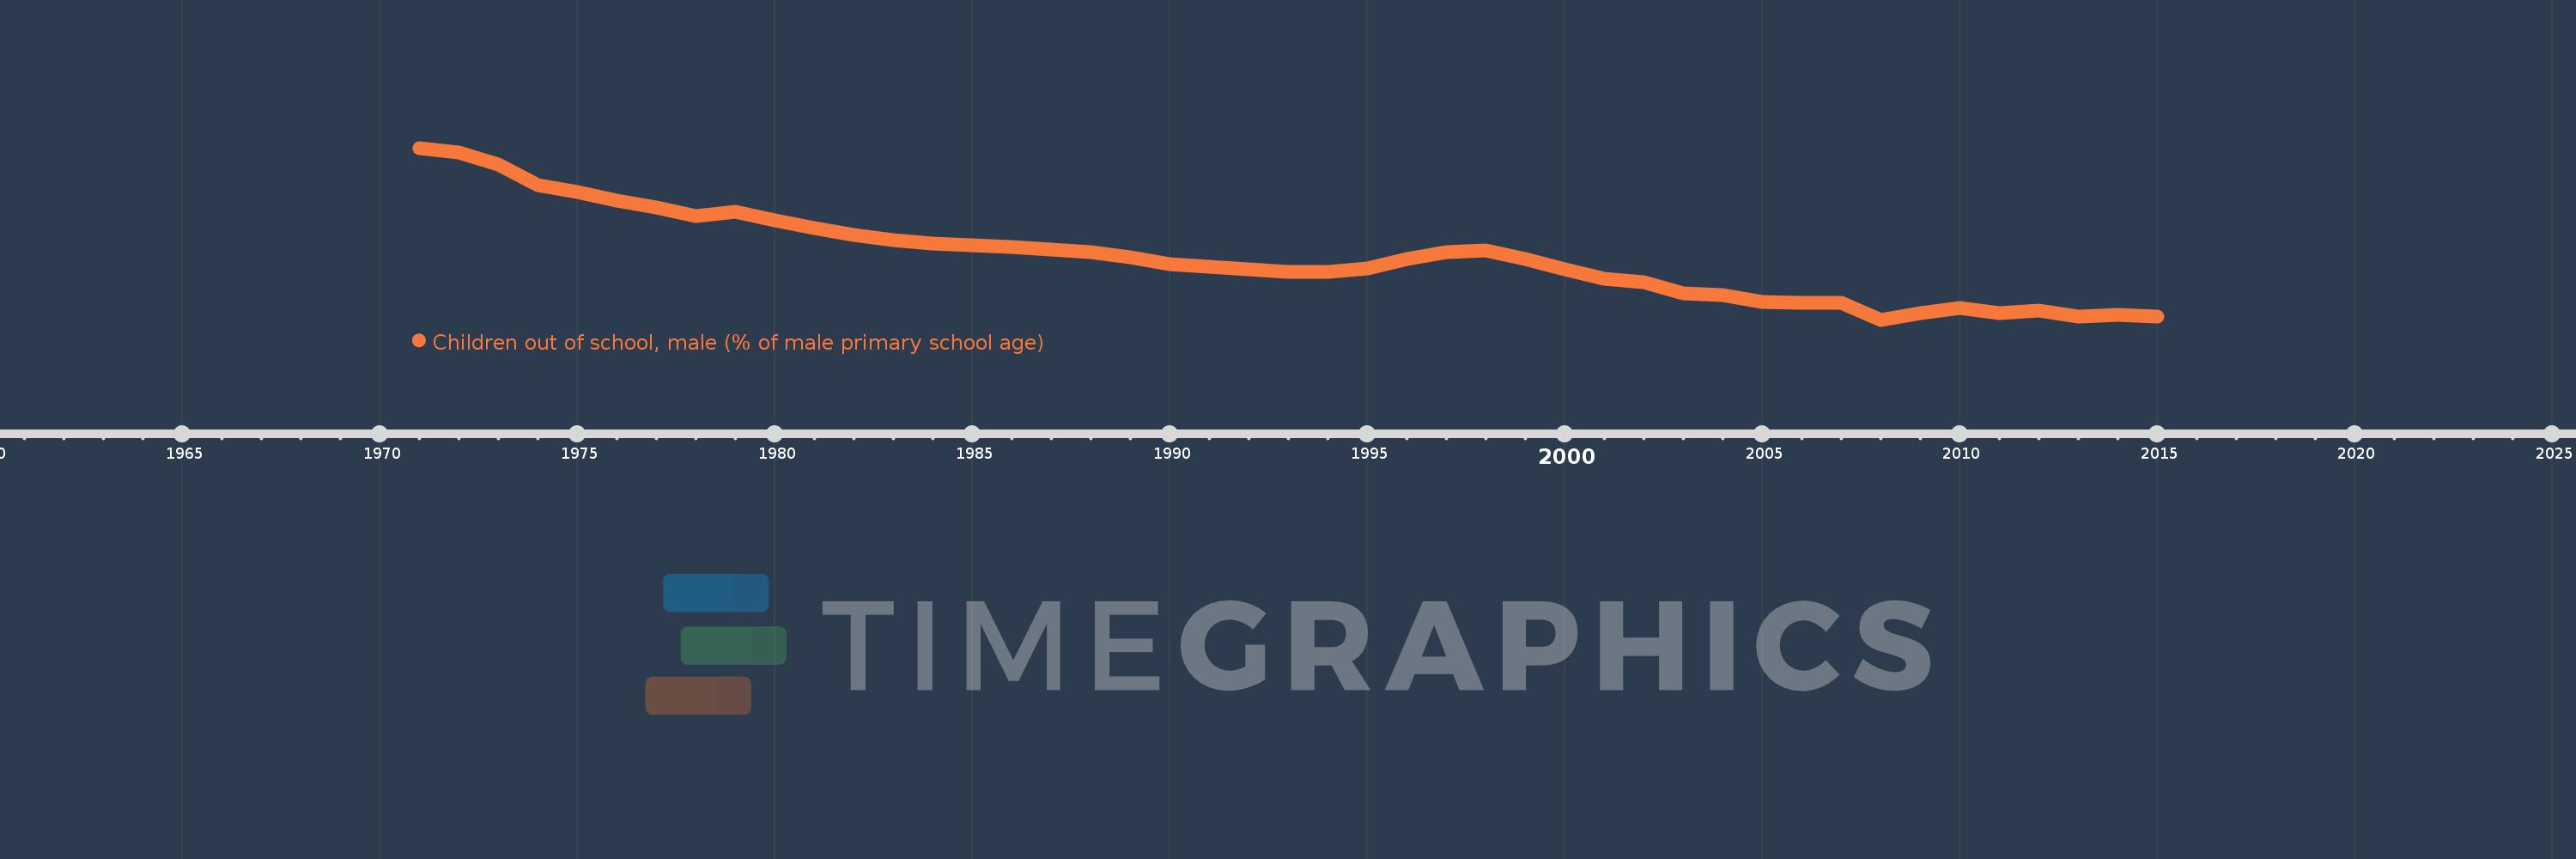
Children out of school, male (% of male primary school age)
2015,2014,2013,2012,2011,2010,2009,2008,2007,2006,2005,2004,2003,2002,2001,2000,1999,1998,1997,1996,1995,1994,1993,1992,1991,1990,1989,1988,1987,1986,1985,1984,1983,1982,1981,1980,1979,1978,1977,1976,1975,1974,1973,1972,1971
This statistics in other country:
AfghanistanAlbaniaAlgeriaAngolaAntigua and BarbudaArab WorldArgentinaArmeniaArubaAustraliaAustriaAzerbaijanBahamas, TheBahrainBangladeshBarbadosBelarusBelgiumBelizeBeninBermudaBhutanBoliviaBosnia and HerzegovinaBotswanaBrazilBrunei DarussalamBulgariaBurkina FasoBurundiCabo VerdeCambodiaCameroonCanadaCaribbean small statesCentral African RepublicCentral Europe and the BalticsChadChileChinaColombiaComorosCongo, Dem. Rep.Congo, Rep.Costa RicaCote d'IvoireCroatiaCubaCyprusDenmarkDjiboutiDominicaDominican RepublicEarly-demographic dividendEast Asia & PacificEast Asia & Pacific (excluding high income)East Asia & Pacific (IDA & IBRD countries)EcuadorEgypt, Arab Rep.El SalvadorEquatorial GuineaEritreaEstoniaEthiopiaEuro areaEurope & Central AsiaEurope & Central Asia (excluding high income)Europe & Central Asia (IDA & IBRD countries)European UnionFijiFinlandFragile and conflict affected situationsFranceGabonGambia, TheGeorgiaGhanaGreeceGrenadaGuatemalaGuineaGuinea-BissauGuyanaHaitiHeavily indebted poor countries (HIPC)High incomeHondurasHong Kong SAR, ChinaHungaryIBRD onlyIcelandIDA & IBRD totalIDA blendIDA onlyIDA totalIndiaIndonesiaIran, Islamic Rep.IraqIrelandIsraelItalyJamaicaJapanJordanKazakhstanKenyaKiribatiKorea, Dem. People’s Rep.Korea, Rep.KuwaitKyrgyz RepublicLao PDRLate-demographic dividendLatin America & Caribbean Latin America & Caribbean (excluding high income)Latin America & the Caribbean (IDA & IBRD countries)LatviaLeast developed countries: UN classificationLebanonLesothoLiberiaLibyaLiechtensteinLithuaniaLow & middle incomeLow incomeLower middle incomeLuxembourgMacao SAR, ChinaMacedonia, FYRMadagascarMalawiMaldivesMaliMaltaMarshall IslandsMauritaniaMauritiusMexicoMicronesia, Fed. Sts.Middle East & North AfricaMiddle East & North Africa (excluding high income)Middle East & North Africa (IDA & IBRD countries)Middle incomeMoldovaMongoliaMontenegroMoroccoMozambiqueMyanmarNamibiaNauruNepalNetherlandsNew ZealandNicaraguaNigerNigeriaNorth AmericaNorwayOECD membersOmanOther small statesPacific island small statesPakistanPanamaPapua New GuineaParaguayPeruPhilippinesPolandPortugalPost-demographic dividendPre-demographic dividendPuerto RicoQatarRomaniaRussian FederationRwandaSamoaSan MarinoSao Tome and PrincipeSaudi ArabiaSenegalSerbiaSeychellesSierra LeoneSloveniaSmall statesSolomon IslandsSomaliaSouth AfricaSouth AsiaSouth Asia (IDA & IBRD)South SudanSpainSri LankaSt. Kitts and NevisSt. LuciaSt. Vincent and the GrenadinesSub-Saharan Africa Sub-Saharan Africa (excluding high income)Sub-Saharan Africa (IDA & IBRD countries)SudanSurinameSwazilandSwedenSwitzerlandSyrian Arab RepublicTajikistanTanzaniaThailandTimor-LesteTogoTongaTrinidad and TobagoTunisiaTurkeyTuvaluUgandaUkraineUnited Arab EmiratesUnited KingdomUnited StatesUpper middle incomeUruguayUzbekistanVanuatuVenezuela, RBWest Bank and GazaWorldYemen, Rep.ZambiaZimbabwe Timeline:
This timeline shows a graph from 1971 to 2015 of Middle income. No data until 1970. Number of actual observations by date: 45.
Source name:
World Development Indicators
Source organization:
United Nations Educational, Scientific, and Cultural Organization (UNESCO) Institute for Statistics.
Categories, topics:
Education
Last updated:
apr 23, 2017
Indicators value changes by year
Maximum:
19.676
jan 1, 1971
At the date of observation
Value
Absolute change
Change from previous value
jan 1, 1971
19.676
+19.676
0.0%
jan 1, 1972
19.356
-0.32
-1.62%
jan 1, 1973
18.432
-0.924
-4.78%
jan 1, 1974
16.929
-1.503
-8.16%
jan 1, 1975
16.404
-0.525
-3.1%
jan 1, 1976
15.759
-0.645
-3.93%
jan 1, 1977
15.243
-0.516
-3.27%
jan 1, 1978
14.643
-0.6
-3.94%
jan 1, 1979
14.949
+0.306
2.09%
jan 1, 1980
14.344
-0.605
-4.05%
jan 1, 1981
13.769
-0.575
-4.01%
jan 1, 1982
13.264
-0.505
-3.67%
jan 1, 1983
12.852
-0.411
-3.1%
jan 1, 1984
12.617
-0.235
-1.83%
jan 1, 1985
12.481
-0.137
-1.08%
jan 1, 1986
12.338
-0.143
-1.15%
jan 1, 1987
12.142
-0.196
-1.59%
jan 1, 1988
11.985
-0.156
-1.29%
jan 1, 1989
11.575
-0.41
-3.42%
jan 1, 1990
11.076
-0.499
-4.31%
jan 1, 1991
10.898
-0.178
-1.6%
jan 1, 1992
10.677
-0.222
-2.03%
jan 1, 1993
10.479
-0.198
-1.85%
jan 1, 1994
10.528
+0.05
0.47%
jan 1, 1995
10.734
+0.205
1.95%
jan 1, 1996
11.491
+0.758
7.06%
jan 1, 1997
11.992
+0.501
4.36%
jan 1, 1998
12.117
+0.125
1.04%
jan 1, 1999
11.49
-0.628
-5.18%
jan 1, 2000
10.689
-0.8
-6.97%
jan 1, 2001
9.992
-0.697
-6.53%
jan 1, 2002
9.753
-0.239
-2.39%
jan 1, 2003
8.921
-0.831
-8.52%
jan 1, 2004
8.804
-0.117
-1.31%
jan 1, 2005
8.294
-0.51
-5.8%
jan 1, 2006
8.233
-0.061
-0.73%
jan 1, 2007
8.239
+0.005
0.06%
jan 1, 2008
6.967
-1.271
-15.43%
jan 1, 2009
7.428
+0.461
6.61%
jan 1, 2010
7.869
+0.441
5.94%
jan 1, 2011
7.477
-0.392
-4.98%
jan 1, 2012
7.627
+0.15
2.01%
jan 1, 2013
7.233
-0.394
-5.17%
jan 1, 2014
7.306
+0.073
1.01%
jan 1, 2015
7.175
-0.131
-1.8%
Ranking of countries by current statistics by years


Comments: