29
/
en
AIzaSyAYiBZKx7MnpbEhh9jyipgxe19OcubqV5w
April 1, 2024
24720
Caribbean small states
CSS
false
2
1
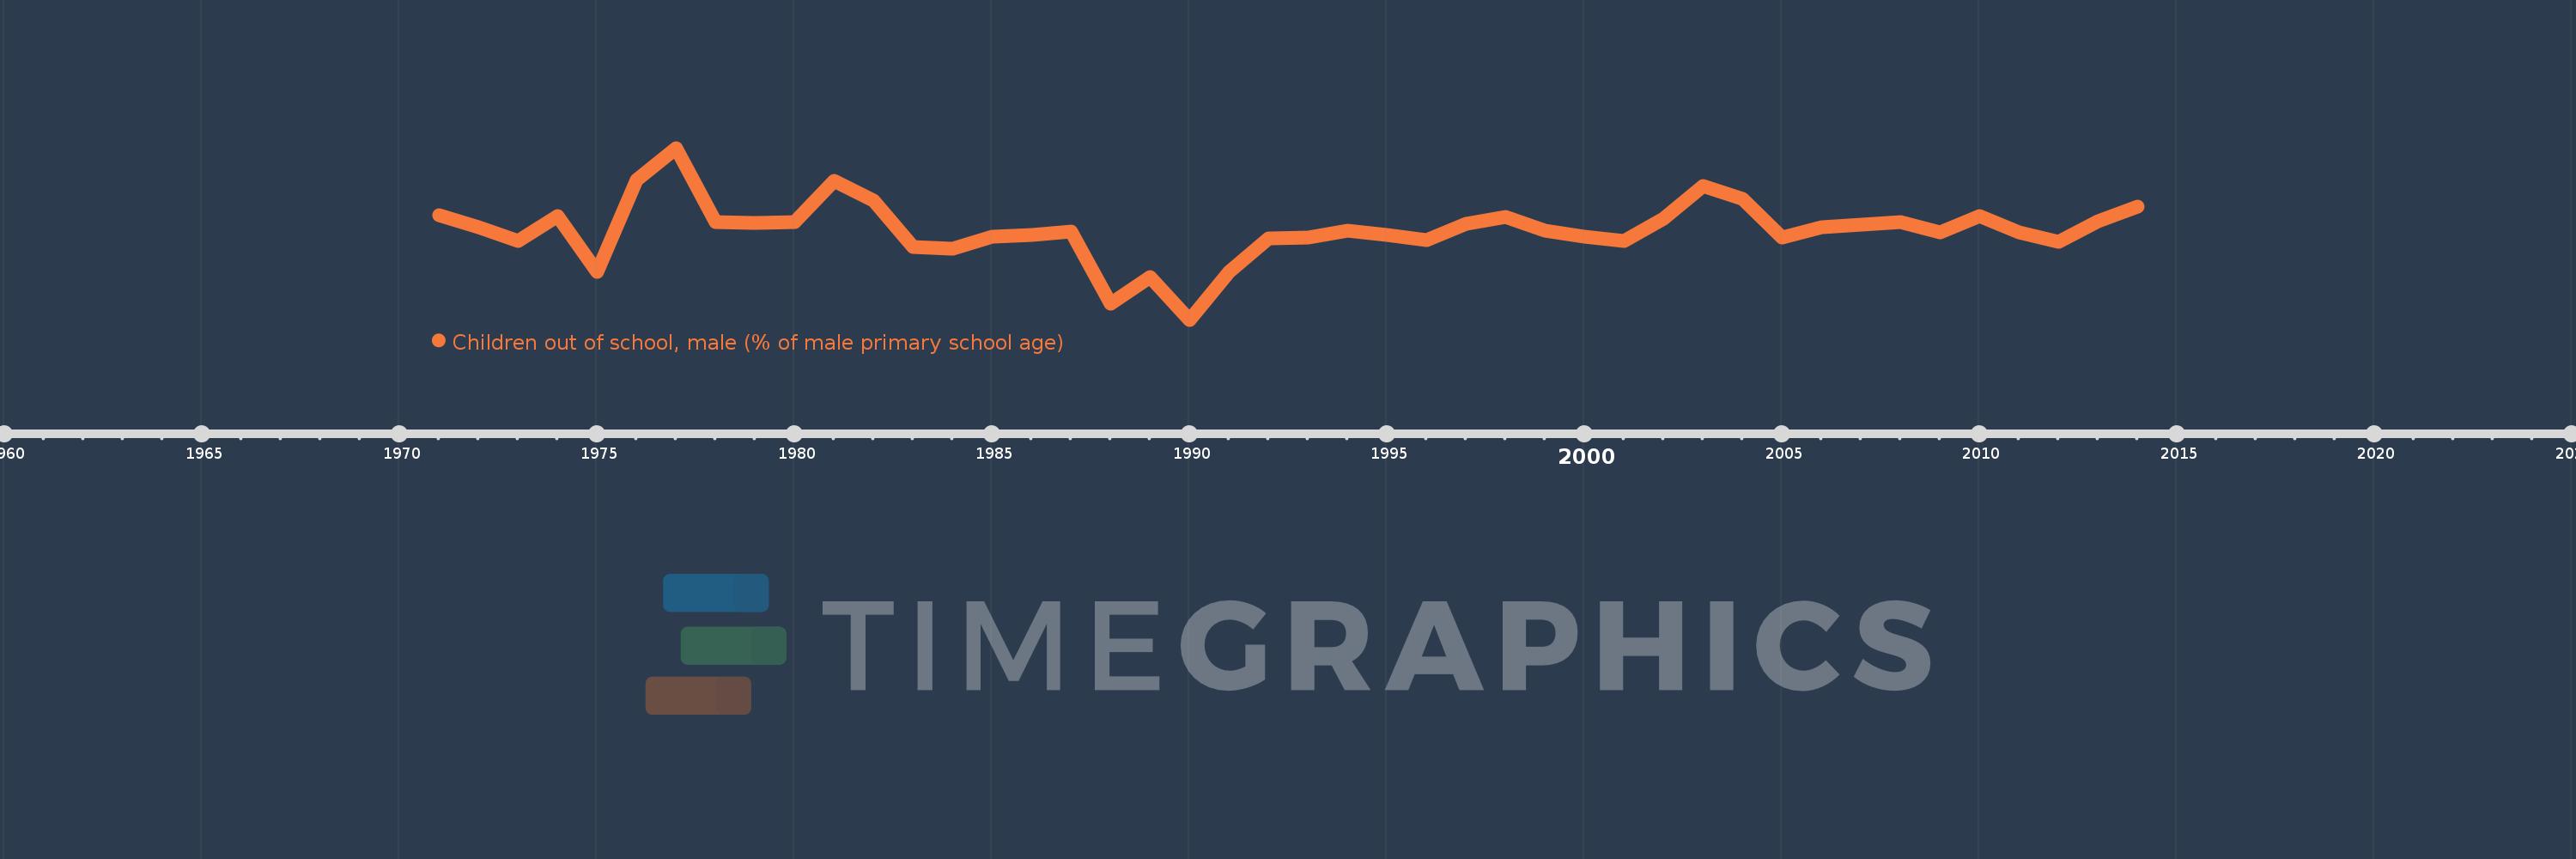
Children out of school, male (% of male primary school age)
2014,2013,2012,2011,2010,2009,2008,2007,2006,2005,2004,2003,2002,2001,2000,1999,1998,1997,1996,1995,1994,1993,1992,1991,1990,1989,1988,1987,1986,1985,1984,1983,1982,1981,1980,1979,1978,1977,1976,1975,1974,1973,1972,1971
This statistics in other country:
AfghanistanAlbaniaAlgeriaAngolaAntigua and BarbudaArab WorldArgentinaArmeniaArubaAustraliaAustriaAzerbaijanBahamas, TheBahrainBangladeshBarbadosBelarusBelgiumBelizeBeninBermudaBhutanBoliviaBosnia and HerzegovinaBotswanaBrazilBrunei DarussalamBulgariaBurkina FasoBurundiCabo VerdeCambodiaCameroonCanadaCaribbean small statesCentral African RepublicCentral Europe and the BalticsChadChileChinaColombiaComorosCongo, Dem. Rep.Congo, Rep.Costa RicaCote d'IvoireCroatiaCubaCyprusDenmarkDjiboutiDominicaDominican RepublicEarly-demographic dividendEast Asia & PacificEast Asia & Pacific (excluding high income)East Asia & Pacific (IDA & IBRD countries)EcuadorEgypt, Arab Rep.El SalvadorEquatorial GuineaEritreaEstoniaEthiopiaEuro areaEurope & Central AsiaEurope & Central Asia (excluding high income)Europe & Central Asia (IDA & IBRD countries)European UnionFijiFinlandFragile and conflict affected situationsFranceGabonGambia, TheGeorgiaGhanaGreeceGrenadaGuatemalaGuineaGuinea-BissauGuyanaHaitiHeavily indebted poor countries (HIPC)High incomeHondurasHong Kong SAR, ChinaHungaryIBRD onlyIcelandIDA & IBRD totalIDA blendIDA onlyIDA totalIndiaIndonesiaIran, Islamic Rep.IraqIrelandIsraelItalyJamaicaJapanJordanKazakhstanKenyaKiribatiKorea, Dem. People’s Rep.Korea, Rep.KuwaitKyrgyz RepublicLao PDRLate-demographic dividendLatin America & Caribbean Latin America & Caribbean (excluding high income)Latin America & the Caribbean (IDA & IBRD countries)LatviaLeast developed countries: UN classificationLebanonLesothoLiberiaLibyaLiechtensteinLithuaniaLow & middle incomeLow incomeLower middle incomeLuxembourgMacao SAR, ChinaMacedonia, FYRMadagascarMalawiMaldivesMaliMaltaMarshall IslandsMauritaniaMauritiusMexicoMicronesia, Fed. Sts.Middle East & North AfricaMiddle East & North Africa (excluding high income)Middle East & North Africa (IDA & IBRD countries)Middle incomeMoldovaMongoliaMontenegroMoroccoMozambiqueMyanmarNamibiaNauruNepalNetherlandsNew ZealandNicaraguaNigerNigeriaNorth AmericaNorwayOECD membersOmanOther small statesPacific island small statesPakistanPanamaPapua New GuineaParaguayPeruPhilippinesPolandPortugalPost-demographic dividendPre-demographic dividendPuerto RicoQatarRomaniaRussian FederationRwandaSamoaSan MarinoSao Tome and PrincipeSaudi ArabiaSenegalSerbiaSeychellesSierra LeoneSloveniaSmall statesSolomon IslandsSomaliaSouth AfricaSouth AsiaSouth Asia (IDA & IBRD)South SudanSpainSri LankaSt. Kitts and NevisSt. LuciaSt. Vincent and the GrenadinesSub-Saharan Africa Sub-Saharan Africa (excluding high income)Sub-Saharan Africa (IDA & IBRD countries)SudanSurinameSwazilandSwedenSwitzerlandSyrian Arab RepublicTajikistanTanzaniaThailandTimor-LesteTogoTongaTrinidad and TobagoTunisiaTurkeyTuvaluUgandaUkraineUnited Arab EmiratesUnited KingdomUnited StatesUpper middle incomeUruguayUzbekistanVanuatuVenezuela, RBWest Bank and GazaWorldYemen, Rep.ZambiaZimbabwe Timeline:
This timeline shows a graph from 1971 to 2014 of Caribbean small states. No data until 1970. Number of actual observations by date: 44.
Source name:
World Development Indicators
Source organization:
United Nations Educational, Scientific, and Cultural Organization (UNESCO) Institute for Statistics.
Categories, topics:
Education
Last updated:
apr 23, 2017
Indicators value changes by year
At the date of observation
Value
Absolute change
Change from previous value
jan 1, 1971
6.854
+6.854
0.0%
jan 1, 1972
6.451
-0.404
-5.89%
jan 1, 1973
6.024
-0.427
-6.62%
jan 1, 1974
6.808
+0.784
13.02%
jan 1, 1975
5.03
-1.779
-26.12%
jan 1, 1976
7.965
+2.936
58.37%
jan 1, 1977
9.007
+1.042
13.08%
jan 1, 1978
6.635
-2.372
-26.34%
jan 1, 1979
6.59
-0.045
-0.67%
jan 1, 1980
6.626
+0.036
0.54%
jan 1, 1981
7.951
+1.325
20.0%
jan 1, 1982
7.32
-0.631
-7.94%
jan 1, 1983
5.83
-1.49
-20.36%
jan 1, 1984
5.761
-0.069
-1.18%
jan 1, 1985
6.155
+0.394
6.83%
jan 1, 1986
6.22
+0.065
1.06%
jan 1, 1987
6.315
+0.095
1.52%
jan 1, 1988
4.019
-2.296
-36.36%
jan 1, 1989
4.874
+0.855
21.28%
jan 1, 1990
3.493
-1.381
-28.33%
jan 1, 1991
5.039
+1.546
44.25%
jan 1, 1992
6.095
+1.055
20.94%
jan 1, 1993
6.138
+0.043
0.71%
jan 1, 1994
6.346
+0.208
3.38%
jan 1, 1995
6.201
-0.144
-2.27%
jan 1, 1996
6.038
-0.164
-2.64%
jan 1, 1997
6.57
+0.532
8.81%
jan 1, 1998
6.8
+0.23
3.5%
jan 1, 1999
6.355
-0.445
-6.55%
jan 1, 2000
6.158
-0.196
-3.09%
jan 1, 2001
6.028
-0.13
-2.11%
jan 1, 2002
6.748
+0.72
11.94%
jan 1, 2003
7.78
+1.032
15.3%
jan 1, 2004
7.361
-0.419
-5.38%
jan 1, 2005
6.134
-1.228
-16.68%
jan 1, 2006
6.468
+0.334
5.45%
jan 1, 2007
6.543
+0.075
1.16%
jan 1, 2008
6.632
+0.089
1.35%
jan 1, 2009
6.305
-0.327
-4.93%
jan 1, 2010
6.807
+0.502
7.96%
jan 1, 2011
6.299
-0.507
-7.46%
jan 1, 2012
5.982
-0.317
-5.04%
jan 1, 2013
6.661
+0.679
11.34%
jan 1, 2014
7.131
+0.47
7.06%
Ranking of countries by current statistics by years


Comments: