29
/
en
AIzaSyAYiBZKx7MnpbEhh9jyipgxe19OcubqV5w
April 1, 2024
94596
Burkina Faso
BFA
true
2
1
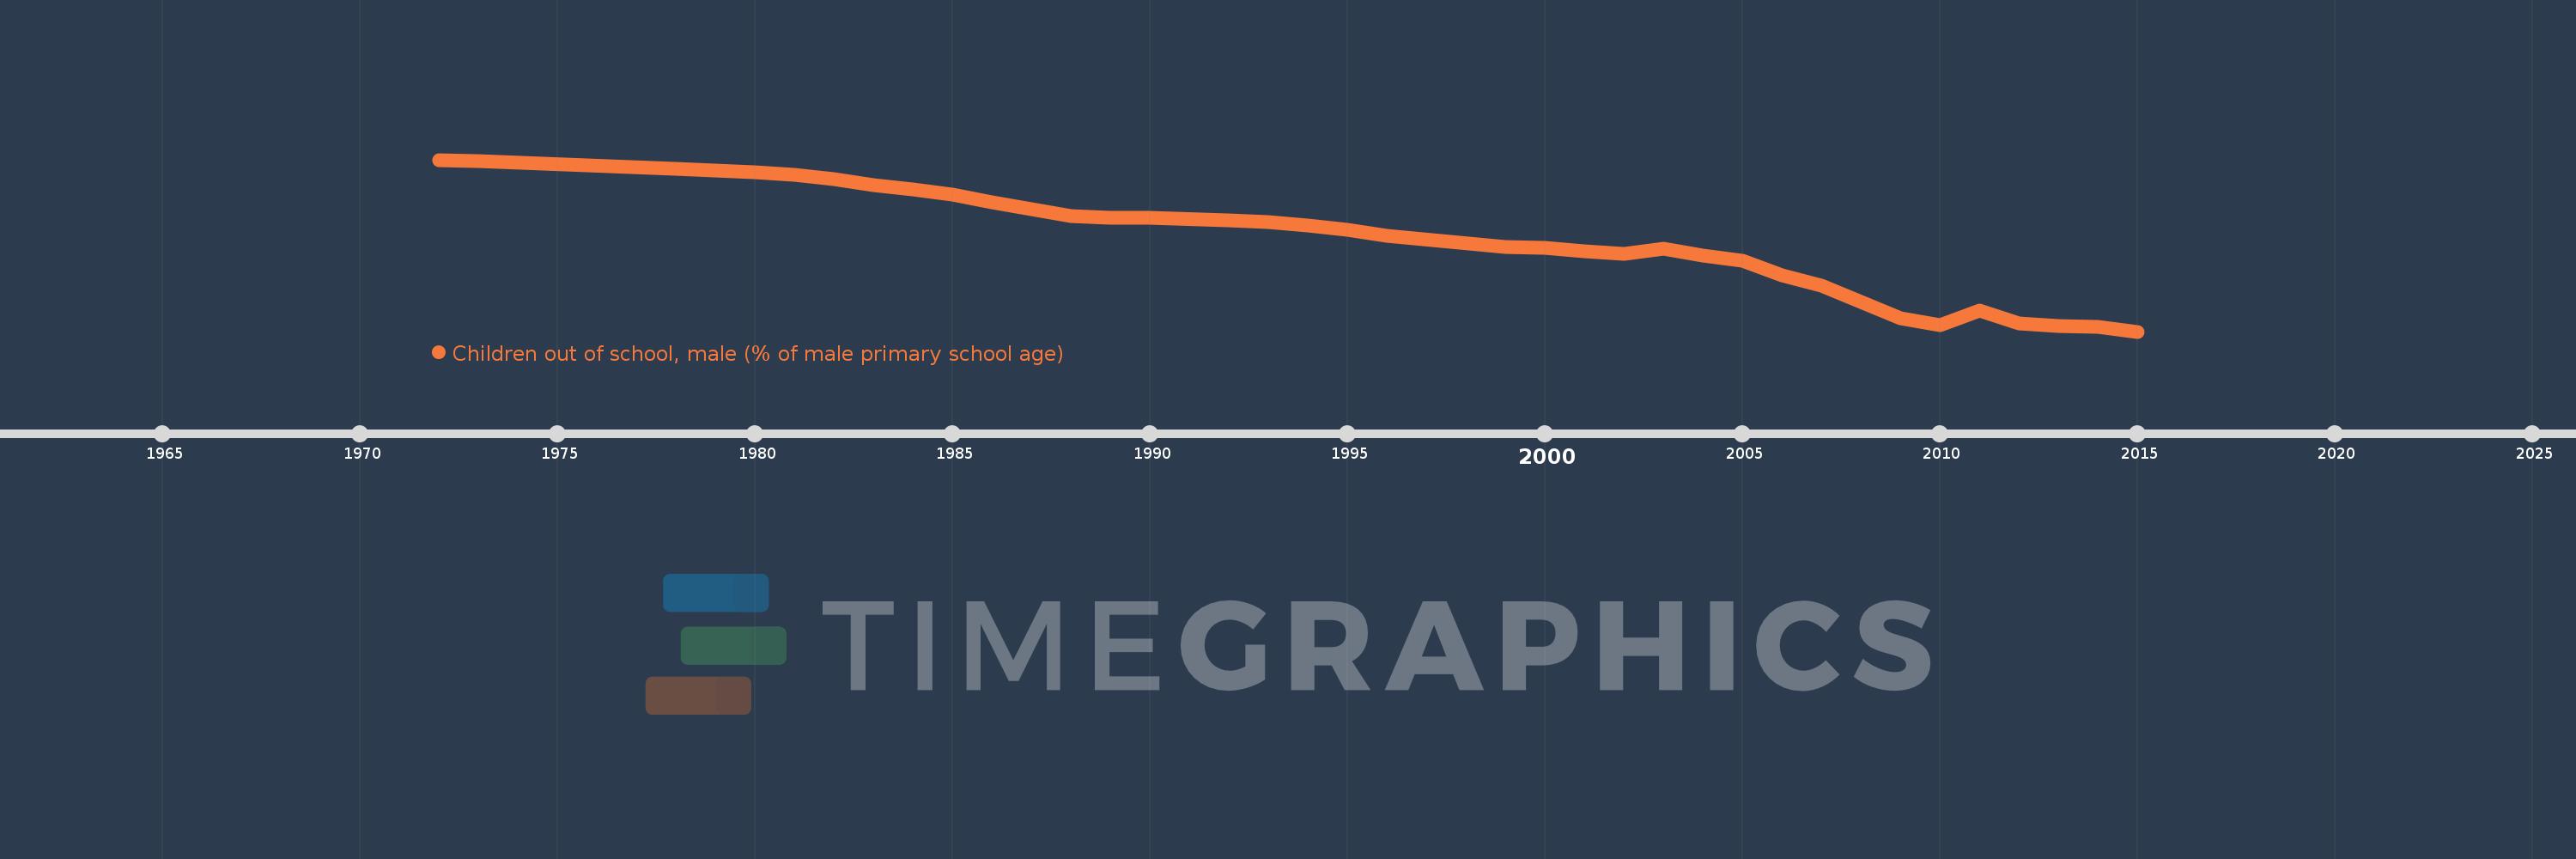
Children out of school, male (% of male primary school age)
2015,2014,2013,2012,2011,2010,2009,2008,2007,2006,2005,2004,2003,2002,2001,2000,1999,1996,1995,1994,1993,1992,1990,1989,1988,1987,1986,1985,1984,1983,1982,1981,1980,1979,1978,1973,1972
This statistics in other country:
AfghanistanAlbaniaAlgeriaAngolaAntigua and BarbudaArab WorldArgentinaArmeniaArubaAustraliaAustriaAzerbaijanBahamas, TheBahrainBangladeshBarbadosBelarusBelgiumBelizeBeninBermudaBhutanBoliviaBosnia and HerzegovinaBotswanaBrazilBrunei DarussalamBulgariaBurkina FasoBurundiCabo VerdeCambodiaCameroonCanadaCaribbean small statesCentral African RepublicCentral Europe and the BalticsChadChileChinaColombiaComorosCongo, Dem. Rep.Congo, Rep.Costa RicaCote d'IvoireCroatiaCubaCyprusDenmarkDjiboutiDominicaDominican RepublicEarly-demographic dividendEast Asia & PacificEast Asia & Pacific (excluding high income)East Asia & Pacific (IDA & IBRD countries)EcuadorEgypt, Arab Rep.El SalvadorEquatorial GuineaEritreaEstoniaEthiopiaEuro areaEurope & Central AsiaEurope & Central Asia (excluding high income)Europe & Central Asia (IDA & IBRD countries)European UnionFijiFinlandFragile and conflict affected situationsFranceGabonGambia, TheGeorgiaGhanaGreeceGrenadaGuatemalaGuineaGuinea-BissauGuyanaHaitiHeavily indebted poor countries (HIPC)High incomeHondurasHong Kong SAR, ChinaHungaryIBRD onlyIcelandIDA & IBRD totalIDA blendIDA onlyIDA totalIndiaIndonesiaIran, Islamic Rep.IraqIrelandIsraelItalyJamaicaJapanJordanKazakhstanKenyaKiribatiKorea, Dem. People’s Rep.Korea, Rep.KuwaitKyrgyz RepublicLao PDRLate-demographic dividendLatin America & Caribbean Latin America & Caribbean (excluding high income)Latin America & the Caribbean (IDA & IBRD countries)LatviaLeast developed countries: UN classificationLebanonLesothoLiberiaLibyaLiechtensteinLithuaniaLow & middle incomeLow incomeLower middle incomeLuxembourgMacao SAR, ChinaMacedonia, FYRMadagascarMalawiMaldivesMaliMaltaMarshall IslandsMauritaniaMauritiusMexicoMicronesia, Fed. Sts.Middle East & North AfricaMiddle East & North Africa (excluding high income)Middle East & North Africa (IDA & IBRD countries)Middle incomeMoldovaMongoliaMontenegroMoroccoMozambiqueMyanmarNamibiaNauruNepalNetherlandsNew ZealandNicaraguaNigerNigeriaNorth AmericaNorwayOECD membersOmanOther small statesPacific island small statesPakistanPanamaPapua New GuineaParaguayPeruPhilippinesPolandPortugalPost-demographic dividendPre-demographic dividendPuerto RicoQatarRomaniaRussian FederationRwandaSamoaSan MarinoSao Tome and PrincipeSaudi ArabiaSenegalSerbiaSeychellesSierra LeoneSloveniaSmall statesSolomon IslandsSomaliaSouth AfricaSouth AsiaSouth Asia (IDA & IBRD)South SudanSpainSri LankaSt. Kitts and NevisSt. LuciaSt. Vincent and the GrenadinesSub-Saharan Africa Sub-Saharan Africa (excluding high income)Sub-Saharan Africa (IDA & IBRD countries)SudanSurinameSwazilandSwedenSwitzerlandSyrian Arab RepublicTajikistanTanzaniaThailandTimor-LesteTogoTongaTrinidad and TobagoTunisiaTurkeyTuvaluUgandaUkraineUnited Arab EmiratesUnited KingdomUnited StatesUpper middle incomeUruguayUzbekistanVanuatuVenezuela, RBWest Bank and GazaWorldYemen, Rep.ZambiaZimbabwe Timeline:
This timeline shows a graph from 1972 to 2015 of Burkina Faso. No data until 1971. Number of actual observations by date: 37.
Source name:
World Development Indicators
Source organization:
United Nations Educational, Scientific, and Cultural Organization (UNESCO) Institute for Statistics.
Categories, topics:
Education
Last updated:
apr 23, 2017
Indicators value changes by year
Minimum:
30.291
jan 1, 2015
At the date of observation
Value
Absolute change
Change from previous value
jan 1, 1972
87.4
+87.4
0.0%
jan 1, 1973
86.989
-0.411
-0.47%
jan 1, 1978
84.316
-2.672
-3.07%
jan 1, 1979
83.714
-0.602
-0.71%
jan 1, 1980
83.144
-0.57
-0.68%
jan 1, 1981
82.286
-0.858
-1.03%
jan 1, 1982
80.947
-1.338
-1.63%
jan 1, 1983
78.995
-1.952
-2.41%
jan 1, 1984
77.614
-1.381
-1.75%
jan 1, 1985
75.79
-1.824
-2.35%
jan 1, 1986
73.203
-2.586
-3.41%
jan 1, 1987
70.868
-2.335
-3.19%
jan 1, 1988
68.697
-2.171
-3.06%
jan 1, 1989
68.227
-0.47
-0.68%
jan 1, 1990
68.092
-0.136
-0.2%
jan 1, 1992
67.178
-0.913
-1.34%
jan 1, 1993
66.604
-0.575
-0.86%
jan 1, 1994
65.507
-1.096
-1.65%
jan 1, 1995
64.038
-1.469
-2.24%
jan 1, 1996
62.075
-1.963
-3.06%
jan 1, 1999
58.537
-3.538
-5.7%
jan 1, 2000
58.19
-0.348
-0.59%
jan 1, 2001
57.066
-1.123
-1.93%
jan 1, 2002
56.196
-0.87
-1.52%
jan 1, 2003
57.781
+1.585
2.82%
jan 1, 2004
55.473
-2.308
-3.99%
jan 1, 2005
53.707
-1.766
-3.18%
jan 1, 2006
48.89
-4.817
-8.97%
jan 1, 2007
45.433
-3.458
-7.07%
jan 1, 2008
40.202
-5.231
-11.51%
jan 1, 2009
34.616
-5.586
-13.89%
jan 1, 2010
32.291
-2.325
-6.72%
jan 1, 2011
37.359
+5.068
15.69%
jan 1, 2012
33.063
-4.296
-11.5%
jan 1, 2013
32.288
-0.776
-2.35%
jan 1, 2014
31.742
-0.546
-1.69%
jan 1, 2015
30.291
-1.45
-4.57%
Ranking of countries by current statistics by years


Comments: