29
/
en
AIzaSyAYiBZKx7MnpbEhh9jyipgxe19OcubqV5w
April 1, 2024
62429
World
WLD
false
2
1
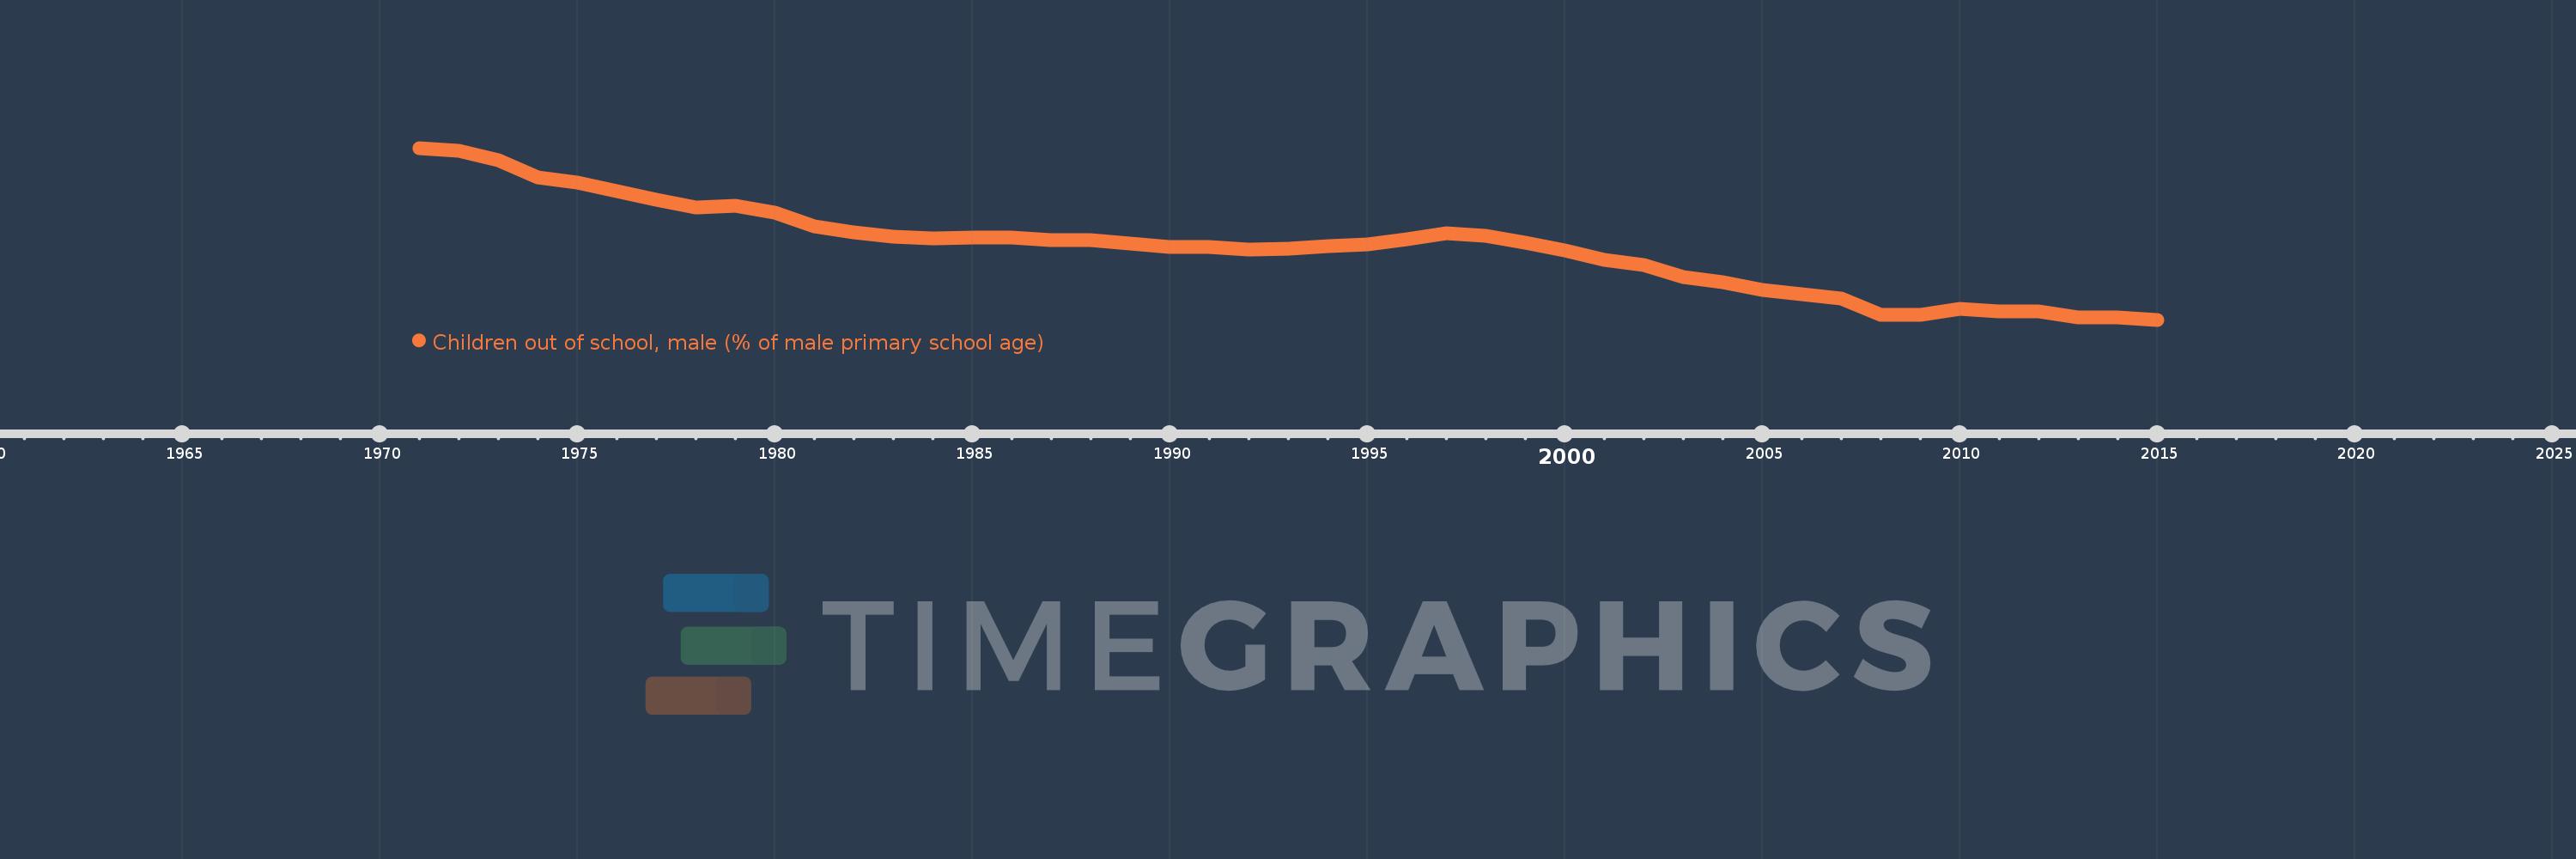
Children out of school, male (% of male primary school age)
2015,2014,2013,2012,2011,2010,2009,2008,2007,2006,2005,2004,2003,2002,2001,2000,1999,1998,1997,1996,1995,1994,1993,1992,1991,1990,1989,1988,1987,1986,1985,1984,1983,1982,1981,1980,1979,1978,1977,1976,1975,1974,1973,1972,1971
This statistics in other country:
AfghanistanAlbaniaAlgeriaAngolaAntigua and BarbudaArab WorldArgentinaArmeniaArubaAustraliaAustriaAzerbaijanBahamas, TheBahrainBangladeshBarbadosBelarusBelgiumBelizeBeninBermudaBhutanBoliviaBosnia and HerzegovinaBotswanaBrazilBrunei DarussalamBulgariaBurkina FasoBurundiCabo VerdeCambodiaCameroonCanadaCaribbean small statesCentral African RepublicCentral Europe and the BalticsChadChileChinaColombiaComorosCongo, Dem. Rep.Congo, Rep.Costa RicaCote d'IvoireCroatiaCubaCyprusDenmarkDjiboutiDominicaDominican RepublicEarly-demographic dividendEast Asia & PacificEast Asia & Pacific (excluding high income)East Asia & Pacific (IDA & IBRD countries)EcuadorEgypt, Arab Rep.El SalvadorEquatorial GuineaEritreaEstoniaEthiopiaEuro areaEurope & Central AsiaEurope & Central Asia (excluding high income)Europe & Central Asia (IDA & IBRD countries)European UnionFijiFinlandFragile and conflict affected situationsFranceGabonGambia, TheGeorgiaGhanaGreeceGrenadaGuatemalaGuineaGuinea-BissauGuyanaHaitiHeavily indebted poor countries (HIPC)High incomeHondurasHong Kong SAR, ChinaHungaryIBRD onlyIcelandIDA & IBRD totalIDA blendIDA onlyIDA totalIndiaIndonesiaIran, Islamic Rep.IraqIrelandIsraelItalyJamaicaJapanJordanKazakhstanKenyaKiribatiKorea, Dem. People’s Rep.Korea, Rep.KuwaitKyrgyz RepublicLao PDRLate-demographic dividendLatin America & Caribbean Latin America & Caribbean (excluding high income)Latin America & the Caribbean (IDA & IBRD countries)LatviaLeast developed countries: UN classificationLebanonLesothoLiberiaLibyaLiechtensteinLithuaniaLow & middle incomeLow incomeLower middle incomeLuxembourgMacao SAR, ChinaMacedonia, FYRMadagascarMalawiMaldivesMaliMaltaMarshall IslandsMauritaniaMauritiusMexicoMicronesia, Fed. Sts.Middle East & North AfricaMiddle East & North Africa (excluding high income)Middle East & North Africa (IDA & IBRD countries)Middle incomeMoldovaMongoliaMontenegroMoroccoMozambiqueMyanmarNamibiaNauruNepalNetherlandsNew ZealandNicaraguaNigerNigeriaNorth AmericaNorwayOECD membersOmanOther small statesPacific island small statesPakistanPanamaPapua New GuineaParaguayPeruPhilippinesPolandPortugalPost-demographic dividendPre-demographic dividendPuerto RicoQatarRomaniaRussian FederationRwandaSamoaSan MarinoSao Tome and PrincipeSaudi ArabiaSenegalSerbiaSeychellesSierra LeoneSloveniaSmall statesSolomon IslandsSomaliaSouth AfricaSouth AsiaSouth Asia (IDA & IBRD)South SudanSpainSri LankaSt. Kitts and NevisSt. LuciaSt. Vincent and the GrenadinesSub-Saharan Africa Sub-Saharan Africa (excluding high income)Sub-Saharan Africa (IDA & IBRD countries)SudanSurinameSwazilandSwedenSwitzerlandSyrian Arab RepublicTajikistanTanzaniaThailandTimor-LesteTogoTongaTrinidad and TobagoTunisiaTurkeyTuvaluUgandaUkraineUnited Arab EmiratesUnited KingdomUnited StatesUpper middle incomeUruguayUzbekistanVanuatuVenezuela, RBWest Bank and GazaWorldYemen, Rep.ZambiaZimbabwe Timeline:
This timeline shows a graph from 1971 to 2015 of World. No data until 1970. Number of actual observations by date: 45.
Source name:
World Development Indicators
Source organization:
United Nations Educational, Scientific, and Cultural Organization (UNESCO) Institute for Statistics.
Categories, topics:
Education
Last updated:
apr 23, 2017
Indicators value changes by year
Maximum:
20.252
jan 1, 1971
At the date of observation
Value
Absolute change
Change from previous value
jan 1, 1971
20.252
+20.252
0.0%
jan 1, 1972
20.039
-0.213
-1.05%
jan 1, 1973
19.396
-0.643
-3.21%
jan 1, 1974
18.163
-1.233
-6.36%
jan 1, 1975
17.817
-0.346
-1.9%
jan 1, 1976
17.207
-0.61
-3.42%
jan 1, 1977
16.624
-0.583
-3.39%
jan 1, 1978
16.046
-0.578
-3.48%
jan 1, 1979
16.183
+0.137
0.85%
jan 1, 1980
15.678
-0.504
-3.12%
jan 1, 1981
14.723
-0.956
-6.1%
jan 1, 1982
14.275
-0.448
-3.04%
jan 1, 1983
13.977
-0.298
-2.08%
jan 1, 1984
13.885
-0.092
-0.66%
jan 1, 1985
13.934
+0.049
0.36%
jan 1, 1986
13.92
-0.014
-0.1%
jan 1, 1987
13.76
-0.16
-1.15%
jan 1, 1988
13.756
-0.004
-0.03%
jan 1, 1989
13.496
-0.259
-1.88%
jan 1, 1990
13.249
-0.248
-1.84%
jan 1, 1991
13.287
+0.038
0.29%
jan 1, 1992
13.082
-0.205
-1.54%
jan 1, 1993
13.17
+0.088
0.67%
jan 1, 1994
13.319
+0.149
1.13%
jan 1, 1995
13.47
+0.151
1.14%
jan 1, 1996
13.811
+0.341
2.53%
jan 1, 1997
14.205
+0.394
2.85%
jan 1, 1998
14.044
-0.161
-1.13%
jan 1, 1999
13.539
-0.506
-3.6%
jan 1, 2000
13.026
-0.512
-3.78%
jan 1, 2001
12.323
-0.703
-5.4%
jan 1, 2002
11.999
-0.324
-2.63%
jan 1, 2003
11.12
-0.879
-7.32%
jan 1, 2004
10.786
-0.334
-3.0%
jan 1, 2005
10.217
-0.57
-5.28%
jan 1, 2006
9.91
-0.307
-3.0%
jan 1, 2007
9.652
-0.258
-2.6%
jan 1, 2008
8.466
-1.186
-12.29%
jan 1, 2009
8.48
+0.014
0.17%
jan 1, 2010
8.905
+0.426
5.02%
jan 1, 2011
8.699
-0.206
-2.31%
jan 1, 2012
8.735
+0.036
0.41%
jan 1, 2013
8.307
-0.428
-4.9%
jan 1, 2014
8.271
-0.036
-0.44%
jan 1, 2015
8.128
-0.143
-1.73%
Ranking of countries by current statistics by years


Comments: