29
/
en
AIzaSyAYiBZKx7MnpbEhh9jyipgxe19OcubqV5w
April 1, 2024
220559
Paraguay
PRY
true
2
1
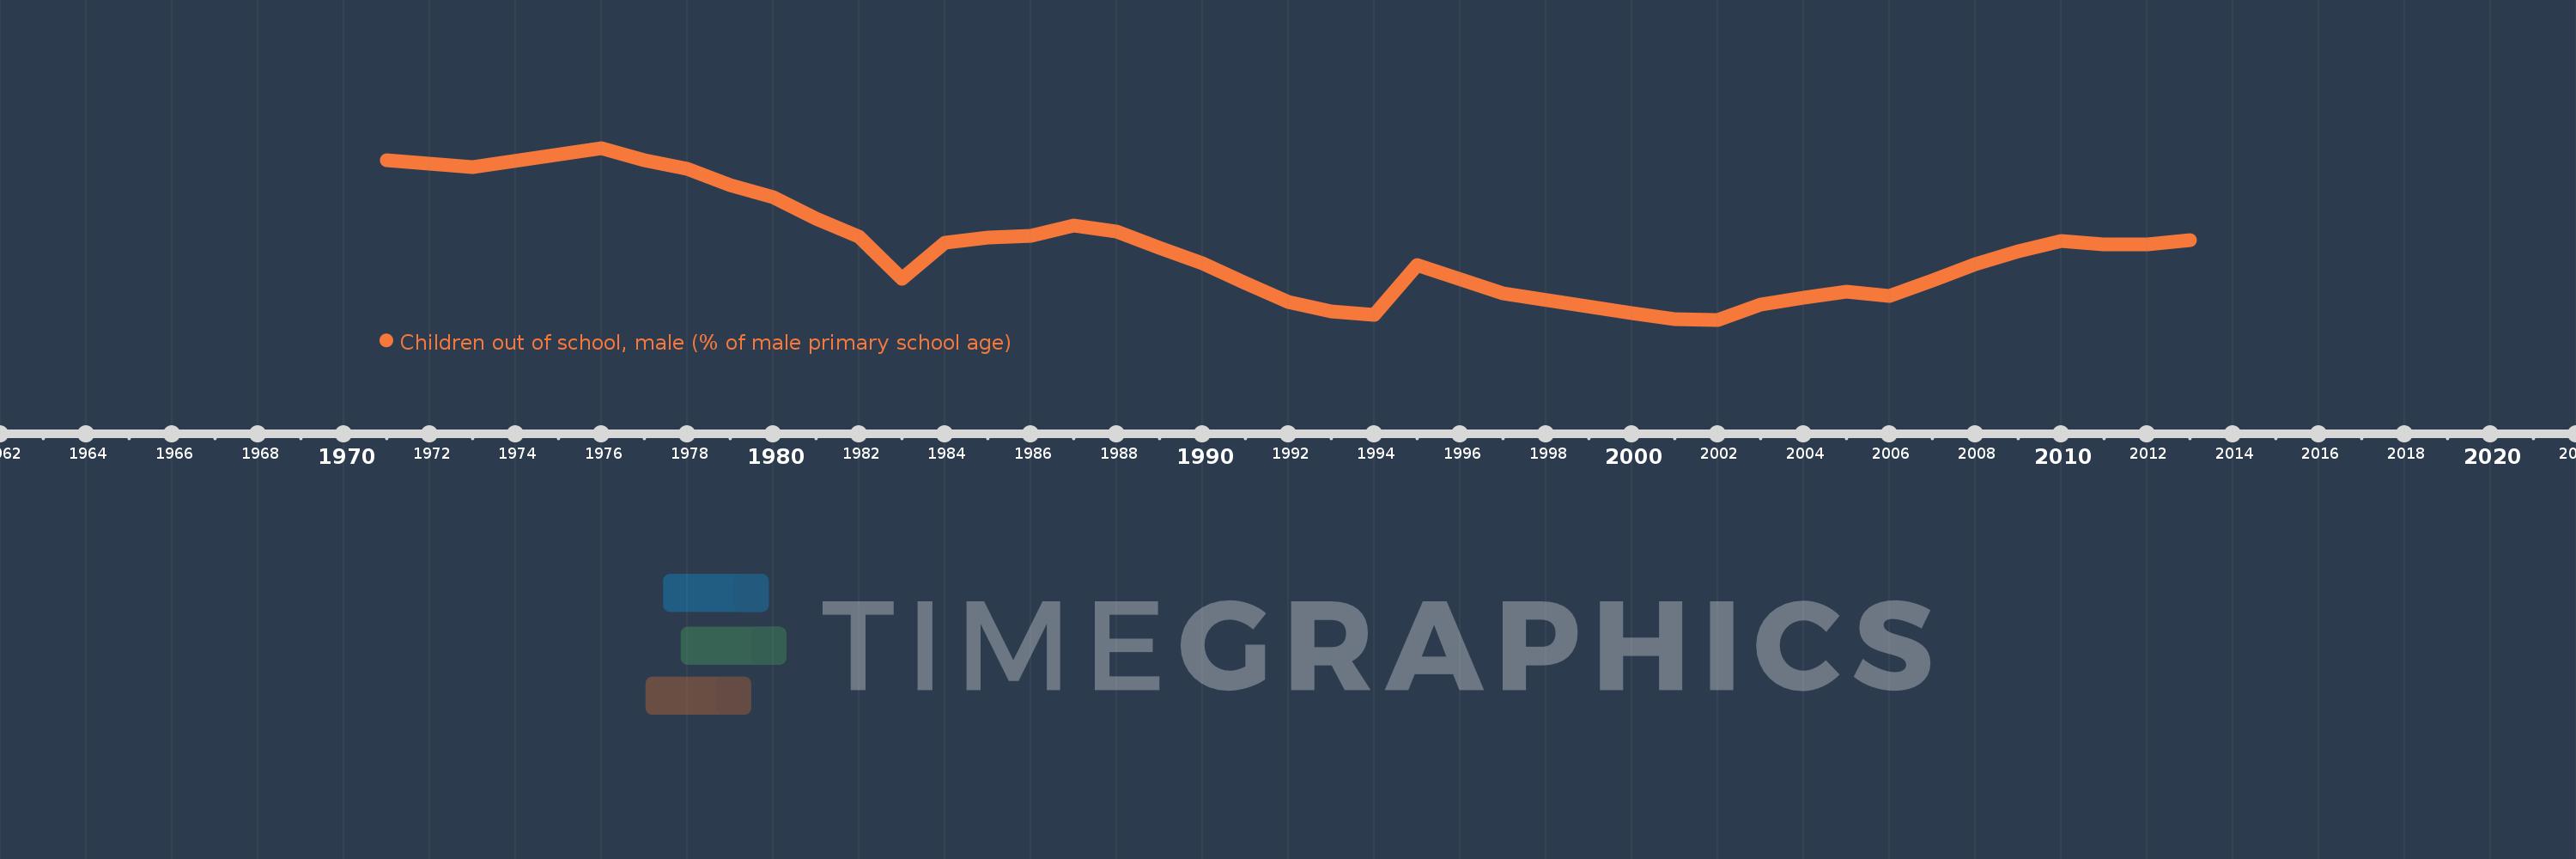
Children out of school, male (% of male primary school age)
2013,2012,2011,2010,2009,2008,2007,2006,2005,2004,2003,2002,2001,2000,1997,1995,1994,1993,1992,1991,1990,1989,1988,1987,1986,1985,1984,1983,1982,1981,1980,1979,1978,1977,1976,1973,1971
This statistics in other country:
AfghanistanAlbaniaAlgeriaAngolaAntigua and BarbudaArab WorldArgentinaArmeniaArubaAustraliaAustriaAzerbaijanBahamas, TheBahrainBangladeshBarbadosBelarusBelgiumBelizeBeninBermudaBhutanBoliviaBosnia and HerzegovinaBotswanaBrazilBrunei DarussalamBulgariaBurkina FasoBurundiCabo VerdeCambodiaCameroonCanadaCaribbean small statesCentral African RepublicCentral Europe and the BalticsChadChileChinaColombiaComorosCongo, Dem. Rep.Congo, Rep.Costa RicaCote d'IvoireCroatiaCubaCyprusDenmarkDjiboutiDominicaDominican RepublicEarly-demographic dividendEast Asia & PacificEast Asia & Pacific (excluding high income)East Asia & Pacific (IDA & IBRD countries)EcuadorEgypt, Arab Rep.El SalvadorEquatorial GuineaEritreaEstoniaEthiopiaEuro areaEurope & Central AsiaEurope & Central Asia (excluding high income)Europe & Central Asia (IDA & IBRD countries)European UnionFijiFinlandFragile and conflict affected situationsFranceGabonGambia, TheGeorgiaGhanaGreeceGrenadaGuatemalaGuineaGuinea-BissauGuyanaHaitiHeavily indebted poor countries (HIPC)High incomeHondurasHong Kong SAR, ChinaHungaryIBRD onlyIcelandIDA & IBRD totalIDA blendIDA onlyIDA totalIndiaIndonesiaIran, Islamic Rep.IraqIrelandIsraelItalyJamaicaJapanJordanKazakhstanKenyaKiribatiKorea, Dem. People’s Rep.Korea, Rep.KuwaitKyrgyz RepublicLao PDRLate-demographic dividendLatin America & Caribbean Latin America & Caribbean (excluding high income)Latin America & the Caribbean (IDA & IBRD countries)LatviaLeast developed countries: UN classificationLebanonLesothoLiberiaLibyaLiechtensteinLithuaniaLow & middle incomeLow incomeLower middle incomeLuxembourgMacao SAR, ChinaMacedonia, FYRMadagascarMalawiMaldivesMaliMaltaMarshall IslandsMauritaniaMauritiusMexicoMicronesia, Fed. Sts.Middle East & North AfricaMiddle East & North Africa (excluding high income)Middle East & North Africa (IDA & IBRD countries)Middle incomeMoldovaMongoliaMontenegroMoroccoMozambiqueMyanmarNamibiaNauruNepalNetherlandsNew ZealandNicaraguaNigerNigeriaNorth AmericaNorwayOECD membersOmanOther small statesPacific island small statesPakistanPanamaPapua New GuineaParaguayPeruPhilippinesPolandPortugalPost-demographic dividendPre-demographic dividendPuerto RicoQatarRomaniaRussian FederationRwandaSamoaSan MarinoSao Tome and PrincipeSaudi ArabiaSenegalSerbiaSeychellesSierra LeoneSloveniaSmall statesSolomon IslandsSomaliaSouth AfricaSouth AsiaSouth Asia (IDA & IBRD)South SudanSpainSri LankaSt. Kitts and NevisSt. LuciaSt. Vincent and the GrenadinesSub-Saharan Africa Sub-Saharan Africa (excluding high income)Sub-Saharan Africa (IDA & IBRD countries)SudanSurinameSwazilandSwedenSwitzerlandSyrian Arab RepublicTajikistanTanzaniaThailandTimor-LesteTogoTongaTrinidad and TobagoTunisiaTurkeyTuvaluUgandaUkraineUnited Arab EmiratesUnited KingdomUnited StatesUpper middle incomeUruguayUzbekistanVanuatuVenezuela, RBWest Bank and GazaWorldYemen, Rep.ZambiaZimbabwe Timeline:
This timeline shows a graph from 1971 to 2013 of Paraguay. No data until 1970. Number of actual observations by date: 37.
Source name:
World Development Indicators
Source organization:
United Nations Educational, Scientific, and Cultural Organization (UNESCO) Institute for Statistics.
Categories, topics:
Education
Last updated:
apr 23, 2017
Indicators value changes by year
At the date of observation
Value
Absolute change
Change from previous value
jan 1, 1971
18.984
+18.984
0.0%
jan 1, 1973
18.273
-0.711
-3.75%
jan 1, 1976
20.23
+1.957
10.71%
jan 1, 1977
18.934
-1.296
-6.4%
jan 1, 1978
18.069
-0.865
-4.57%
jan 1, 1979
16.406
-1.662
-9.2%
jan 1, 1980
15.129
-1.277
-7.78%
jan 1, 1981
12.929
-2.201
-14.55%
jan 1, 1982
11.06
-1.869
-14.46%
jan 1, 1983
6.686
-4.373
-39.54%
jan 1, 1984
10.423
+3.736
55.88%
jan 1, 1985
10.969
+0.547
5.25%
jan 1, 1986
11.163
+0.194
1.77%
jan 1, 1987
12.204
+1.041
9.33%
jan 1, 1988
11.559
-0.645
-5.29%
jan 1, 1989
9.913
-1.646
-14.24%
jan 1, 1990
8.244
-1.67
-16.84%
jan 1, 1991
6.218
-2.025
-24.57%
jan 1, 1992
4.304
-1.914
-30.78%
jan 1, 1993
3.275
-1.03
-23.92%
jan 1, 1994
2.929
-0.346
-10.56%
jan 1, 1995
8.091
+5.162
176.26%
jan 1, 1997
5.175
-2.916
-36.04%
jan 1, 2000
3.109
-2.067
-39.93%
jan 1, 2001
2.507
-0.601
-19.35%
jan 1, 2002
2.425
-0.083
-3.29%
jan 1, 2003
4.026
+1.601
66.03%
jan 1, 2004
4.746
+0.72
17.9%
jan 1, 2005
5.368
+0.622
13.11%
jan 1, 2006
4.932
-0.436
-8.12%
jan 1, 2007
6.517
+1.584
32.12%
jan 1, 2008
8.171
+1.654
25.38%
jan 1, 2009
9.52
+1.349
16.51%
jan 1, 2010
10.593
+1.072
11.26%
jan 1, 2011
10.207
-0.385
-3.64%
jan 1, 2012
10.232
+0.025
0.24%
jan 1, 2013
10.66
+0.428
4.18%
Ranking of countries by current statistics by years


Comments: