29
/
en
AIzaSyAYiBZKx7MnpbEhh9jyipgxe19OcubqV5w
April 1, 2024
36402
IBRD only
IBD
false
2
1
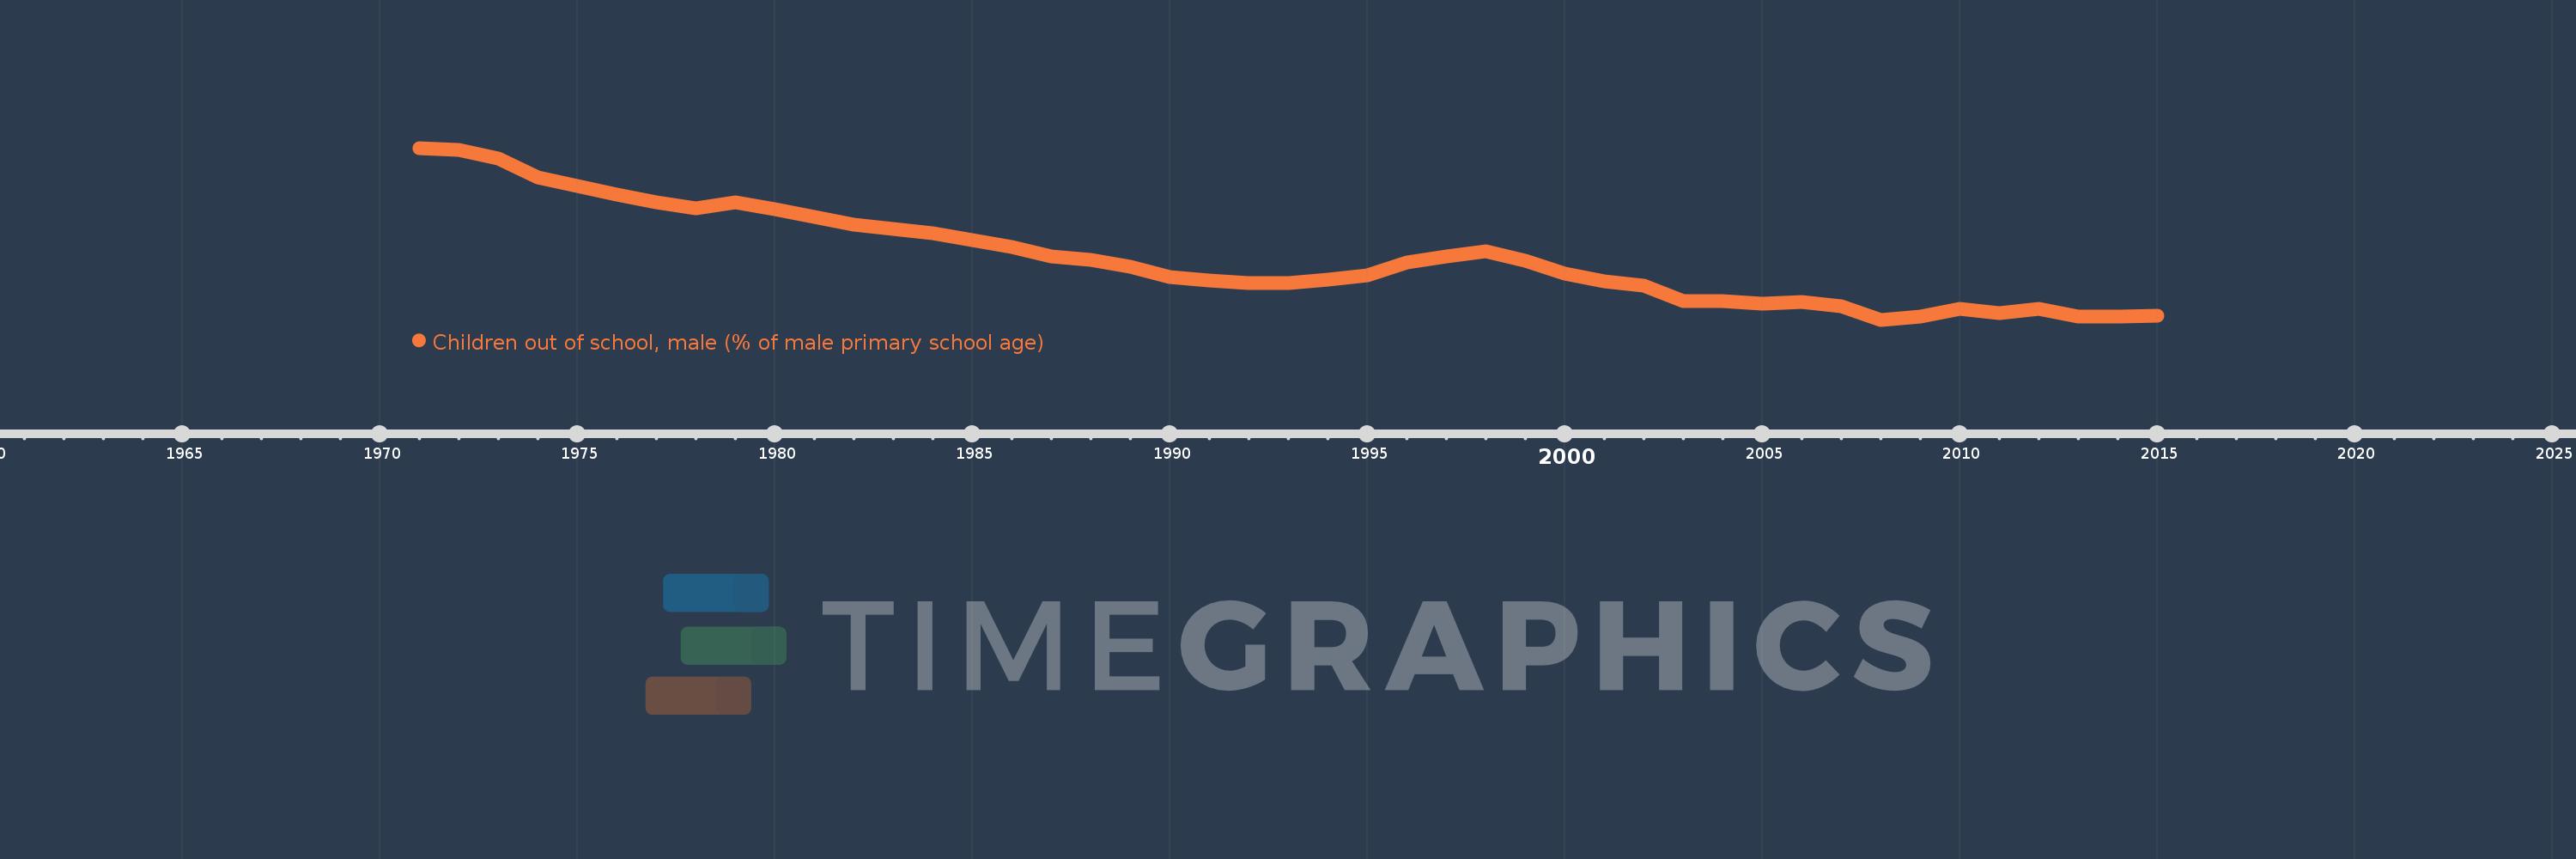
Children out of school, male (% of male primary school age)
2015,2014,2013,2012,2011,2010,2009,2008,2007,2006,2005,2004,2003,2002,2001,2000,1999,1998,1997,1996,1995,1994,1993,1992,1991,1990,1989,1988,1987,1986,1985,1984,1983,1982,1981,1980,1979,1978,1977,1976,1975,1974,1973,1972,1971
This statistics in other country:
AfghanistanAlbaniaAlgeriaAngolaAntigua and BarbudaArab WorldArgentinaArmeniaArubaAustraliaAustriaAzerbaijanBahamas, TheBahrainBangladeshBarbadosBelarusBelgiumBelizeBeninBermudaBhutanBoliviaBosnia and HerzegovinaBotswanaBrazilBrunei DarussalamBulgariaBurkina FasoBurundiCabo VerdeCambodiaCameroonCanadaCaribbean small statesCentral African RepublicCentral Europe and the BalticsChadChileChinaColombiaComorosCongo, Dem. Rep.Congo, Rep.Costa RicaCote d'IvoireCroatiaCubaCyprusDenmarkDjiboutiDominicaDominican RepublicEarly-demographic dividendEast Asia & PacificEast Asia & Pacific (excluding high income)East Asia & Pacific (IDA & IBRD countries)EcuadorEgypt, Arab Rep.El SalvadorEquatorial GuineaEritreaEstoniaEthiopiaEuro areaEurope & Central AsiaEurope & Central Asia (excluding high income)Europe & Central Asia (IDA & IBRD countries)European UnionFijiFinlandFragile and conflict affected situationsFranceGabonGambia, TheGeorgiaGhanaGreeceGrenadaGuatemalaGuineaGuinea-BissauGuyanaHaitiHeavily indebted poor countries (HIPC)High incomeHondurasHong Kong SAR, ChinaHungaryIBRD onlyIcelandIDA & IBRD totalIDA blendIDA onlyIDA totalIndiaIndonesiaIran, Islamic Rep.IraqIrelandIsraelItalyJamaicaJapanJordanKazakhstanKenyaKiribatiKorea, Dem. People’s Rep.Korea, Rep.KuwaitKyrgyz RepublicLao PDRLate-demographic dividendLatin America & Caribbean Latin America & Caribbean (excluding high income)Latin America & the Caribbean (IDA & IBRD countries)LatviaLeast developed countries: UN classificationLebanonLesothoLiberiaLibyaLiechtensteinLithuaniaLow & middle incomeLow incomeLower middle incomeLuxembourgMacao SAR, ChinaMacedonia, FYRMadagascarMalawiMaldivesMaliMaltaMarshall IslandsMauritaniaMauritiusMexicoMicronesia, Fed. Sts.Middle East & North AfricaMiddle East & North Africa (excluding high income)Middle East & North Africa (IDA & IBRD countries)Middle incomeMoldovaMongoliaMontenegroMoroccoMozambiqueMyanmarNamibiaNauruNepalNetherlandsNew ZealandNicaraguaNigerNigeriaNorth AmericaNorwayOECD membersOmanOther small statesPacific island small statesPakistanPanamaPapua New GuineaParaguayPeruPhilippinesPolandPortugalPost-demographic dividendPre-demographic dividendPuerto RicoQatarRomaniaRussian FederationRwandaSamoaSan MarinoSao Tome and PrincipeSaudi ArabiaSenegalSerbiaSeychellesSierra LeoneSloveniaSmall statesSolomon IslandsSomaliaSouth AfricaSouth AsiaSouth Asia (IDA & IBRD)South SudanSpainSri LankaSt. Kitts and NevisSt. LuciaSt. Vincent and the GrenadinesSub-Saharan Africa Sub-Saharan Africa (excluding high income)Sub-Saharan Africa (IDA & IBRD countries)SudanSurinameSwazilandSwedenSwitzerlandSyrian Arab RepublicTajikistanTanzaniaThailandTimor-LesteTogoTongaTrinidad and TobagoTunisiaTurkeyTuvaluUgandaUkraineUnited Arab EmiratesUnited KingdomUnited StatesUpper middle incomeUruguayUzbekistanVanuatuVenezuela, RBWest Bank and GazaWorldYemen, Rep.ZambiaZimbabwe Timeline:
This timeline shows a graph from 1971 to 2015 of IBRD only. No data until 1970. Number of actual observations by date: 45.
Source name:
World Development Indicators
Source organization:
United Nations Educational, Scientific, and Cultural Organization (UNESCO) Institute for Statistics.
Categories, topics:
Education
Last updated:
apr 23, 2017
Indicators value changes by year
Maximum:
15.843
jan 1, 1971
At the date of observation
Value
Absolute change
Change from previous value
jan 1, 1971
15.843
+15.843
0.0%
jan 1, 1972
15.73
-0.113
-0.71%
jan 1, 1973
15.133
-0.596
-3.79%
jan 1, 1974
13.788
-1.346
-8.89%
jan 1, 1975
13.222
-0.566
-4.1%
jan 1, 1976
12.605
-0.617
-4.67%
jan 1, 1977
12.089
-0.516
-4.09%
jan 1, 1978
11.666
-0.424
-3.5%
jan 1, 1979
12.063
+0.398
3.41%
jan 1, 1980
11.565
-0.499
-4.14%
jan 1, 1981
11.049
-0.516
-4.46%
jan 1, 1982
10.499
-0.55
-4.97%
jan 1, 1983
10.209
-0.29
-2.76%
jan 1, 1984
9.907
-0.302
-2.96%
jan 1, 1985
9.428
-0.479
-4.83%
jan 1, 1986
8.962
-0.467
-4.95%
jan 1, 1987
8.309
-0.652
-7.28%
jan 1, 1988
8.056
-0.253
-3.05%
jan 1, 1989
7.613
-0.443
-5.5%
jan 1, 1990
6.872
-0.741
-9.73%
jan 1, 1991
6.613
-0.259
-3.77%
jan 1, 1992
6.477
-0.136
-2.06%
jan 1, 1993
6.448
-0.029
-0.44%
jan 1, 1994
6.685
+0.237
3.67%
jan 1, 1995
7.015
+0.33
4.94%
jan 1, 1996
7.882
+0.868
12.37%
jan 1, 1997
8.3
+0.417
5.29%
jan 1, 1998
8.646
+0.346
4.17%
jan 1, 1999
8.0
-0.646
-7.48%
jan 1, 2000
7.093
-0.907
-11.33%
jan 1, 2001
6.577
-0.516
-7.27%
jan 1, 2002
6.288
-0.29
-4.41%
jan 1, 2003
5.203
-1.085
-17.25%
jan 1, 2004
5.218
+0.016
0.3%
jan 1, 2005
5.026
-0.192
-3.69%
jan 1, 2006
5.121
+0.095
1.88%
jan 1, 2007
4.877
-0.244
-4.77%
jan 1, 2008
3.911
-0.966
-19.8%
jan 1, 2009
4.107
+0.196
5.02%
jan 1, 2010
4.671
+0.564
13.72%
jan 1, 2011
4.374
-0.297
-6.36%
jan 1, 2012
4.67
+0.296
6.77%
jan 1, 2013
4.116
-0.554
-11.87%
jan 1, 2014
4.126
+0.01
0.24%
jan 1, 2015
4.162
+0.037
0.89%
Ranking of countries by current statistics by years


Comments: