29
/
en
AIzaSyAYiBZKx7MnpbEhh9jyipgxe19OcubqV5w
April 1, 2024
116682
Cyprus
CYP
true
2
1
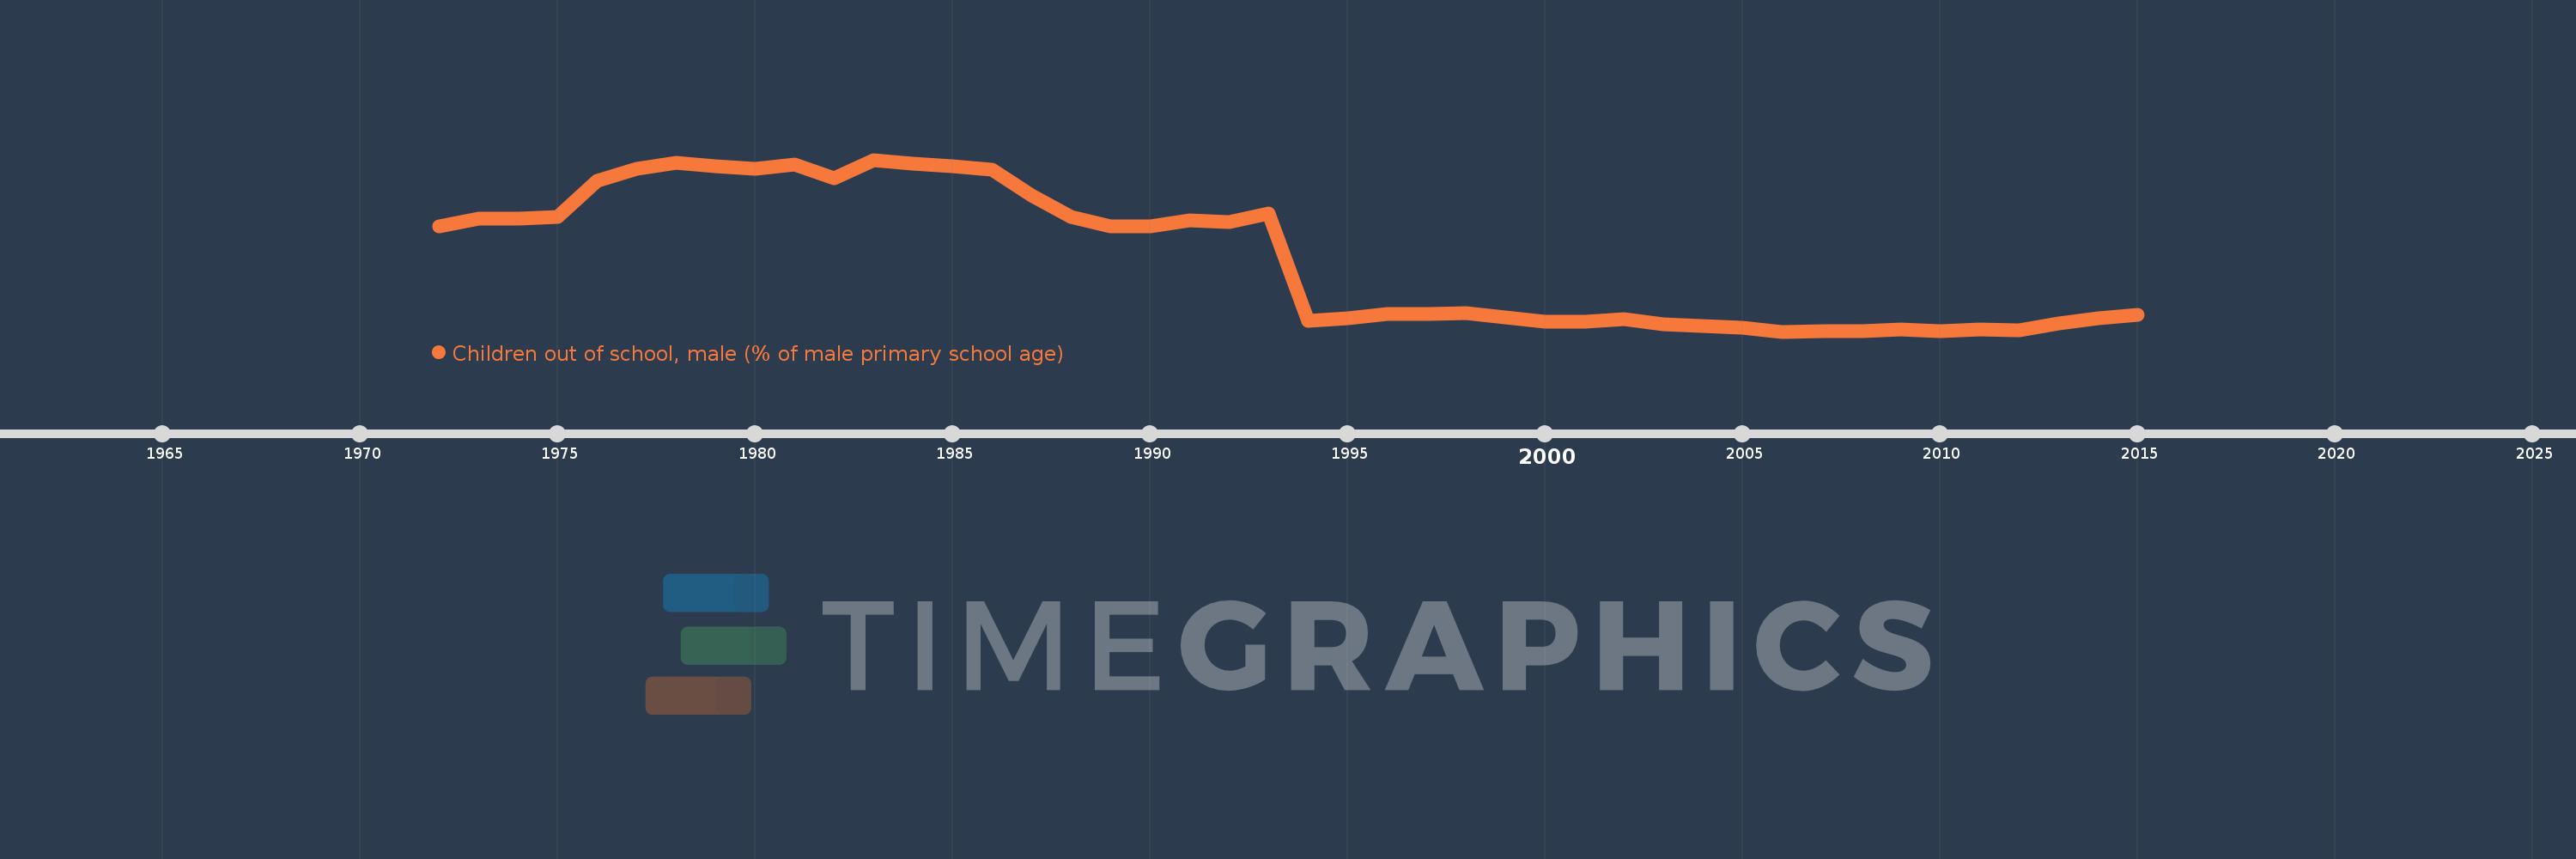
Children out of school, male (% of male primary school age)
2015,2014,2013,2012,2011,2010,2009,2008,2007,2006,2005,2004,2003,2002,2001,2000,1998,1997,1996,1995,1994,1993,1992,1991,1990,1989,1988,1987,1986,1985,1984,1983,1982,1981,1980,1979,1978,1977,1976,1975,1974,1973,1972
This statistics in other country:
AfghanistanAlbaniaAlgeriaAngolaAntigua and BarbudaArab WorldArgentinaArmeniaArubaAustraliaAustriaAzerbaijanBahamas, TheBahrainBangladeshBarbadosBelarusBelgiumBelizeBeninBermudaBhutanBoliviaBosnia and HerzegovinaBotswanaBrazilBrunei DarussalamBulgariaBurkina FasoBurundiCabo VerdeCambodiaCameroonCanadaCaribbean small statesCentral African RepublicCentral Europe and the BalticsChadChileChinaColombiaComorosCongo, Dem. Rep.Congo, Rep.Costa RicaCote d'IvoireCroatiaCubaCyprusDenmarkDjiboutiDominicaDominican RepublicEarly-demographic dividendEast Asia & PacificEast Asia & Pacific (excluding high income)East Asia & Pacific (IDA & IBRD countries)EcuadorEgypt, Arab Rep.El SalvadorEquatorial GuineaEritreaEstoniaEthiopiaEuro areaEurope & Central AsiaEurope & Central Asia (excluding high income)Europe & Central Asia (IDA & IBRD countries)European UnionFijiFinlandFragile and conflict affected situationsFranceGabonGambia, TheGeorgiaGhanaGreeceGrenadaGuatemalaGuineaGuinea-BissauGuyanaHaitiHeavily indebted poor countries (HIPC)High incomeHondurasHong Kong SAR, ChinaHungaryIBRD onlyIcelandIDA & IBRD totalIDA blendIDA onlyIDA totalIndiaIndonesiaIran, Islamic Rep.IraqIrelandIsraelItalyJamaicaJapanJordanKazakhstanKenyaKiribatiKorea, Dem. People’s Rep.Korea, Rep.KuwaitKyrgyz RepublicLao PDRLate-demographic dividendLatin America & Caribbean Latin America & Caribbean (excluding high income)Latin America & the Caribbean (IDA & IBRD countries)LatviaLeast developed countries: UN classificationLebanonLesothoLiberiaLibyaLiechtensteinLithuaniaLow & middle incomeLow incomeLower middle incomeLuxembourgMacao SAR, ChinaMacedonia, FYRMadagascarMalawiMaldivesMaliMaltaMarshall IslandsMauritaniaMauritiusMexicoMicronesia, Fed. Sts.Middle East & North AfricaMiddle East & North Africa (excluding high income)Middle East & North Africa (IDA & IBRD countries)Middle incomeMoldovaMongoliaMontenegroMoroccoMozambiqueMyanmarNamibiaNauruNepalNetherlandsNew ZealandNicaraguaNigerNigeriaNorth AmericaNorwayOECD membersOmanOther small statesPacific island small statesPakistanPanamaPapua New GuineaParaguayPeruPhilippinesPolandPortugalPost-demographic dividendPre-demographic dividendPuerto RicoQatarRomaniaRussian FederationRwandaSamoaSan MarinoSao Tome and PrincipeSaudi ArabiaSenegalSerbiaSeychellesSierra LeoneSloveniaSmall statesSolomon IslandsSomaliaSouth AfricaSouth AsiaSouth Asia (IDA & IBRD)South SudanSpainSri LankaSt. Kitts and NevisSt. LuciaSt. Vincent and the GrenadinesSub-Saharan Africa Sub-Saharan Africa (excluding high income)Sub-Saharan Africa (IDA & IBRD countries)SudanSurinameSwazilandSwedenSwitzerlandSyrian Arab RepublicTajikistanTanzaniaThailandTimor-LesteTogoTongaTrinidad and TobagoTunisiaTurkeyTuvaluUgandaUkraineUnited Arab EmiratesUnited KingdomUnited StatesUpper middle incomeUruguayUzbekistanVanuatuVenezuela, RBWest Bank and GazaWorldYemen, Rep.ZambiaZimbabwe Timeline:
This timeline shows a graph from 1972 to 2015 of Cyprus. No data until 1971. Number of actual observations by date: 43.
Source name:
World Development Indicators
Source organization:
United Nations Educational, Scientific, and Cultural Organization (UNESCO) Institute for Statistics.
Categories, topics:
Education
Last updated:
apr 23, 2017
Indicators value changes by year
Maximum:
32.531
jan 1, 1983
At the date of observation
Value
Absolute change
Change from previous value
jan 1, 1972
20.118
+20.118
0.0%
jan 1, 1973
21.465
+1.347
6.7%
jan 1, 1974
21.507
+0.042
0.2%
jan 1, 1975
21.832
+0.325
1.51%
jan 1, 1976
28.564
+6.733
30.84%
jan 1, 1977
30.796
+2.232
7.81%
jan 1, 1978
31.953
+1.157
3.76%
jan 1, 1979
31.303
-0.65
-2.03%
jan 1, 1980
30.828
-0.475
-1.52%
jan 1, 1981
31.721
+0.893
2.9%
jan 1, 1982
29.076
-2.646
-8.34%
jan 1, 1983
32.531
+3.456
11.88%
jan 1, 1984
31.862
-0.669
-2.06%
jan 1, 1985
31.368
-0.494
-1.55%
jan 1, 1986
30.629
-0.739
-2.36%
jan 1, 1987
25.915
-4.713
-15.39%
jan 1, 1988
21.792
-4.123
-15.91%
jan 1, 1989
20.126
-1.666
-7.65%
jan 1, 1990
20.068
-0.058
-0.29%
jan 1, 1991
21.139
+1.071
5.34%
jan 1, 1992
20.844
-0.295
-1.4%
jan 1, 1993
22.488
+1.644
7.89%
jan 1, 1994
2.407
-20.081
-89.3%
jan 1, 1995
2.955
+0.547
22.74%
jan 1, 1996
3.71
+0.756
25.58%
jan 1, 1997
3.64
-0.071
-1.9%
jan 1, 1998
3.801
+0.161
4.42%
jan 1, 2000
2.339
-1.462
-38.46%
jan 1, 2001
2.245
-0.094
-4.02%
jan 1, 2002
2.721
+0.476
21.22%
jan 1, 2003
1.752
-0.969
-35.62%
jan 1, 2004
1.539
-0.213
-12.16%
jan 1, 2005
1.177
-0.362
-23.52%
jan 1, 2006
0.418
-0.759
-64.48%
jan 1, 2007
0.477
+0.059
14.02%
jan 1, 2008
0.563
+0.086
18.1%
jan 1, 2009
0.758
+0.195
34.69%
jan 1, 2010
0.571
-0.187
-24.72%
jan 1, 2011
0.885
+0.314
54.97%
jan 1, 2012
0.685
-0.2
-22.62%
jan 1, 2013
1.984
+1.299
189.81%
jan 1, 2014
2.92
+0.936
47.17%
jan 1, 2015
3.48
+0.561
19.2%
Ranking of countries by current statistics by years


Comments: