29
/
en
AIzaSyAYiBZKx7MnpbEhh9jyipgxe19OcubqV5w
April 1, 2024
171494
Kuwait
KWT
true
2
1
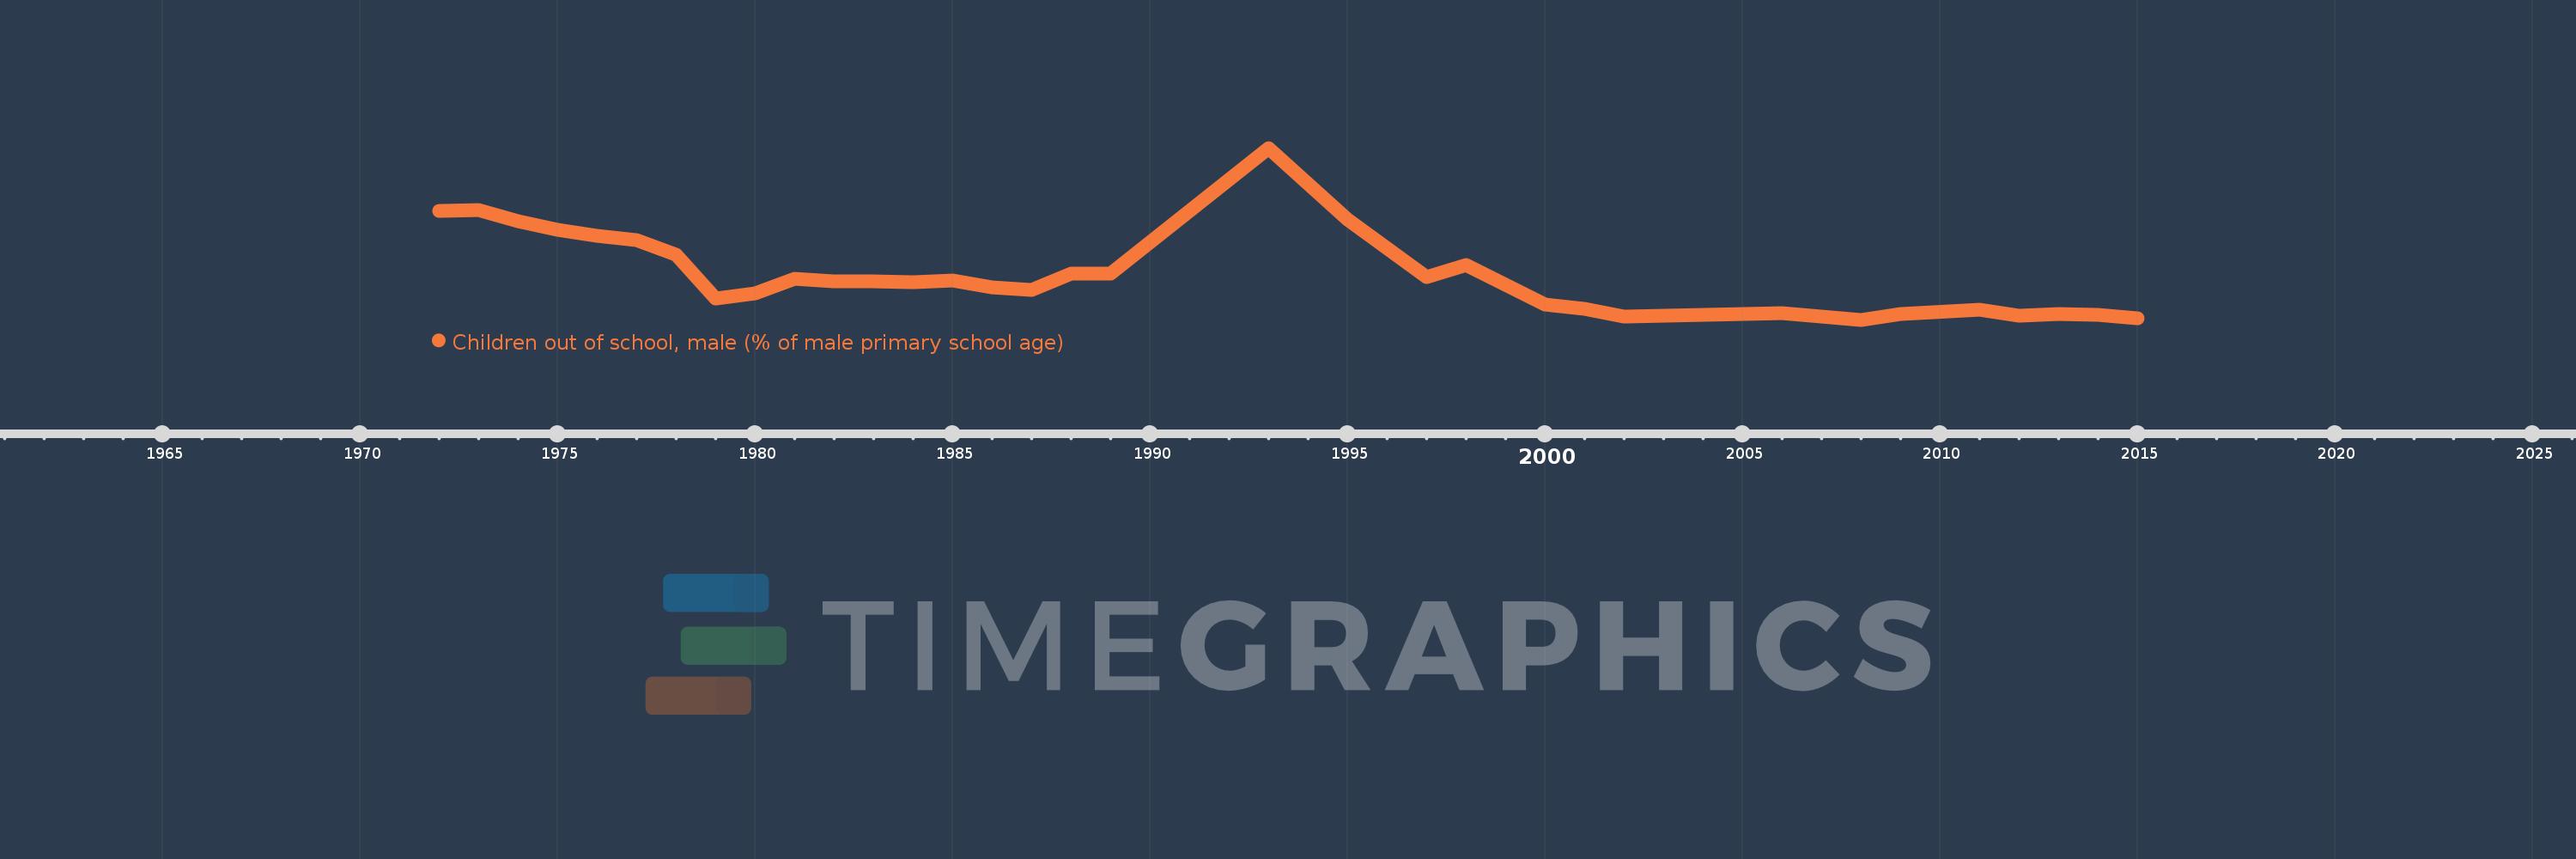
Children out of school, male (% of male primary school age)
2015,2014,2013,2012,2011,2009,2008,2006,2002,2001,2000,1998,1997,1995,1993,1989,1988,1987,1986,1985,1984,1983,1982,1981,1980,1979,1978,1977,1976,1975,1974,1973,1972
This statistics in other country:
AfghanistanAlbaniaAlgeriaAngolaAntigua and BarbudaArab WorldArgentinaArmeniaArubaAustraliaAustriaAzerbaijanBahamas, TheBahrainBangladeshBarbadosBelarusBelgiumBelizeBeninBermudaBhutanBoliviaBosnia and HerzegovinaBotswanaBrazilBrunei DarussalamBulgariaBurkina FasoBurundiCabo VerdeCambodiaCameroonCanadaCaribbean small statesCentral African RepublicCentral Europe and the BalticsChadChileChinaColombiaComorosCongo, Dem. Rep.Congo, Rep.Costa RicaCote d'IvoireCroatiaCubaCyprusDenmarkDjiboutiDominicaDominican RepublicEarly-demographic dividendEast Asia & PacificEast Asia & Pacific (excluding high income)East Asia & Pacific (IDA & IBRD countries)EcuadorEgypt, Arab Rep.El SalvadorEquatorial GuineaEritreaEstoniaEthiopiaEuro areaEurope & Central AsiaEurope & Central Asia (excluding high income)Europe & Central Asia (IDA & IBRD countries)European UnionFijiFinlandFragile and conflict affected situationsFranceGabonGambia, TheGeorgiaGhanaGreeceGrenadaGuatemalaGuineaGuinea-BissauGuyanaHaitiHeavily indebted poor countries (HIPC)High incomeHondurasHong Kong SAR, ChinaHungaryIBRD onlyIcelandIDA & IBRD totalIDA blendIDA onlyIDA totalIndiaIndonesiaIran, Islamic Rep.IraqIrelandIsraelItalyJamaicaJapanJordanKazakhstanKenyaKiribatiKorea, Dem. People’s Rep.Korea, Rep.KuwaitKyrgyz RepublicLao PDRLate-demographic dividendLatin America & Caribbean Latin America & Caribbean (excluding high income)Latin America & the Caribbean (IDA & IBRD countries)LatviaLeast developed countries: UN classificationLebanonLesothoLiberiaLibyaLiechtensteinLithuaniaLow & middle incomeLow incomeLower middle incomeLuxembourgMacao SAR, ChinaMacedonia, FYRMadagascarMalawiMaldivesMaliMaltaMarshall IslandsMauritaniaMauritiusMexicoMicronesia, Fed. Sts.Middle East & North AfricaMiddle East & North Africa (excluding high income)Middle East & North Africa (IDA & IBRD countries)Middle incomeMoldovaMongoliaMontenegroMoroccoMozambiqueMyanmarNamibiaNauruNepalNetherlandsNew ZealandNicaraguaNigerNigeriaNorth AmericaNorwayOECD membersOmanOther small statesPacific island small statesPakistanPanamaPapua New GuineaParaguayPeruPhilippinesPolandPortugalPost-demographic dividendPre-demographic dividendPuerto RicoQatarRomaniaRussian FederationRwandaSamoaSan MarinoSao Tome and PrincipeSaudi ArabiaSenegalSerbiaSeychellesSierra LeoneSloveniaSmall statesSolomon IslandsSomaliaSouth AfricaSouth AsiaSouth Asia (IDA & IBRD)South SudanSpainSri LankaSt. Kitts and NevisSt. LuciaSt. Vincent and the GrenadinesSub-Saharan Africa Sub-Saharan Africa (excluding high income)Sub-Saharan Africa (IDA & IBRD countries)SudanSurinameSwazilandSwedenSwitzerlandSyrian Arab RepublicTajikistanTanzaniaThailandTimor-LesteTogoTongaTrinidad and TobagoTunisiaTurkeyTuvaluUgandaUkraineUnited Arab EmiratesUnited KingdomUnited StatesUpper middle incomeUruguayUzbekistanVanuatuVenezuela, RBWest Bank and GazaWorldYemen, Rep.ZambiaZimbabwe Timeline:
This timeline shows a graph from 1972 to 2015 of Kuwait. No data until 1971. Number of actual observations by date: 33.
Source name:
World Development Indicators
Source organization:
United Nations Educational, Scientific, and Cultural Organization (UNESCO) Institute for Statistics.
Categories, topics:
Education
Last updated:
apr 23, 2017
Indicators value changes by year
Maximum:
50.538
jan 1, 1993
At the date of observation
Value
Absolute change
Change from previous value
jan 1, 1972
32.667
+32.667
0.0%
jan 1, 1973
32.926
+0.259
0.79%
jan 1, 1974
29.718
-3.208
-9.74%
jan 1, 1975
27.252
-2.466
-8.3%
jan 1, 1976
25.405
-1.848
-6.78%
jan 1, 1977
24.213
-1.192
-4.69%
jan 1, 1978
20.008
-4.205
-17.37%
jan 1, 1979
7.755
-12.253
-61.24%
jan 1, 1980
9.071
+1.316
16.98%
jan 1, 1981
13.385
+4.314
47.56%
jan 1, 1982
12.587
-0.797
-5.96%
jan 1, 1983
12.523
-0.064
-0.51%
jan 1, 1984
12.292
-0.231
-1.85%
jan 1, 1985
12.886
+0.594
4.83%
jan 1, 1986
10.78
-2.106
-16.35%
jan 1, 1987
10.112
-0.668
-6.2%
jan 1, 1988
14.698
+4.586
45.35%
jan 1, 1989
14.623
-0.075
-0.51%
jan 1, 1993
50.538
+35.916
245.62%
jan 1, 1995
30.052
-20.486
-40.54%
jan 1, 1997
13.821
-16.23
-54.01%
jan 1, 1998
17.105
+3.284
23.76%
jan 1, 2000
5.915
-11.19
-65.42%
jan 1, 2001
4.82
-1.095
-18.51%
jan 1, 2002
2.551
-2.269
-47.07%
jan 1, 2006
3.396
+0.845
33.12%
jan 1, 2008
1.594
-1.802
-53.07%
jan 1, 2009
3.204
+1.611
101.05%
jan 1, 2011
4.355
+1.151
35.9%
jan 1, 2012
2.625
-1.73
-39.72%
jan 1, 2013
3.331
+0.706
26.87%
jan 1, 2014
3.052
-0.279
-8.36%
jan 1, 2015
1.897
-1.156
-37.87%
Ranking of countries by current statistics by years


Comments: