29
/
en
AIzaSyAYiBZKx7MnpbEhh9jyipgxe19OcubqV5w
April 1, 2024
215065
Oman
OMN
true
2
1
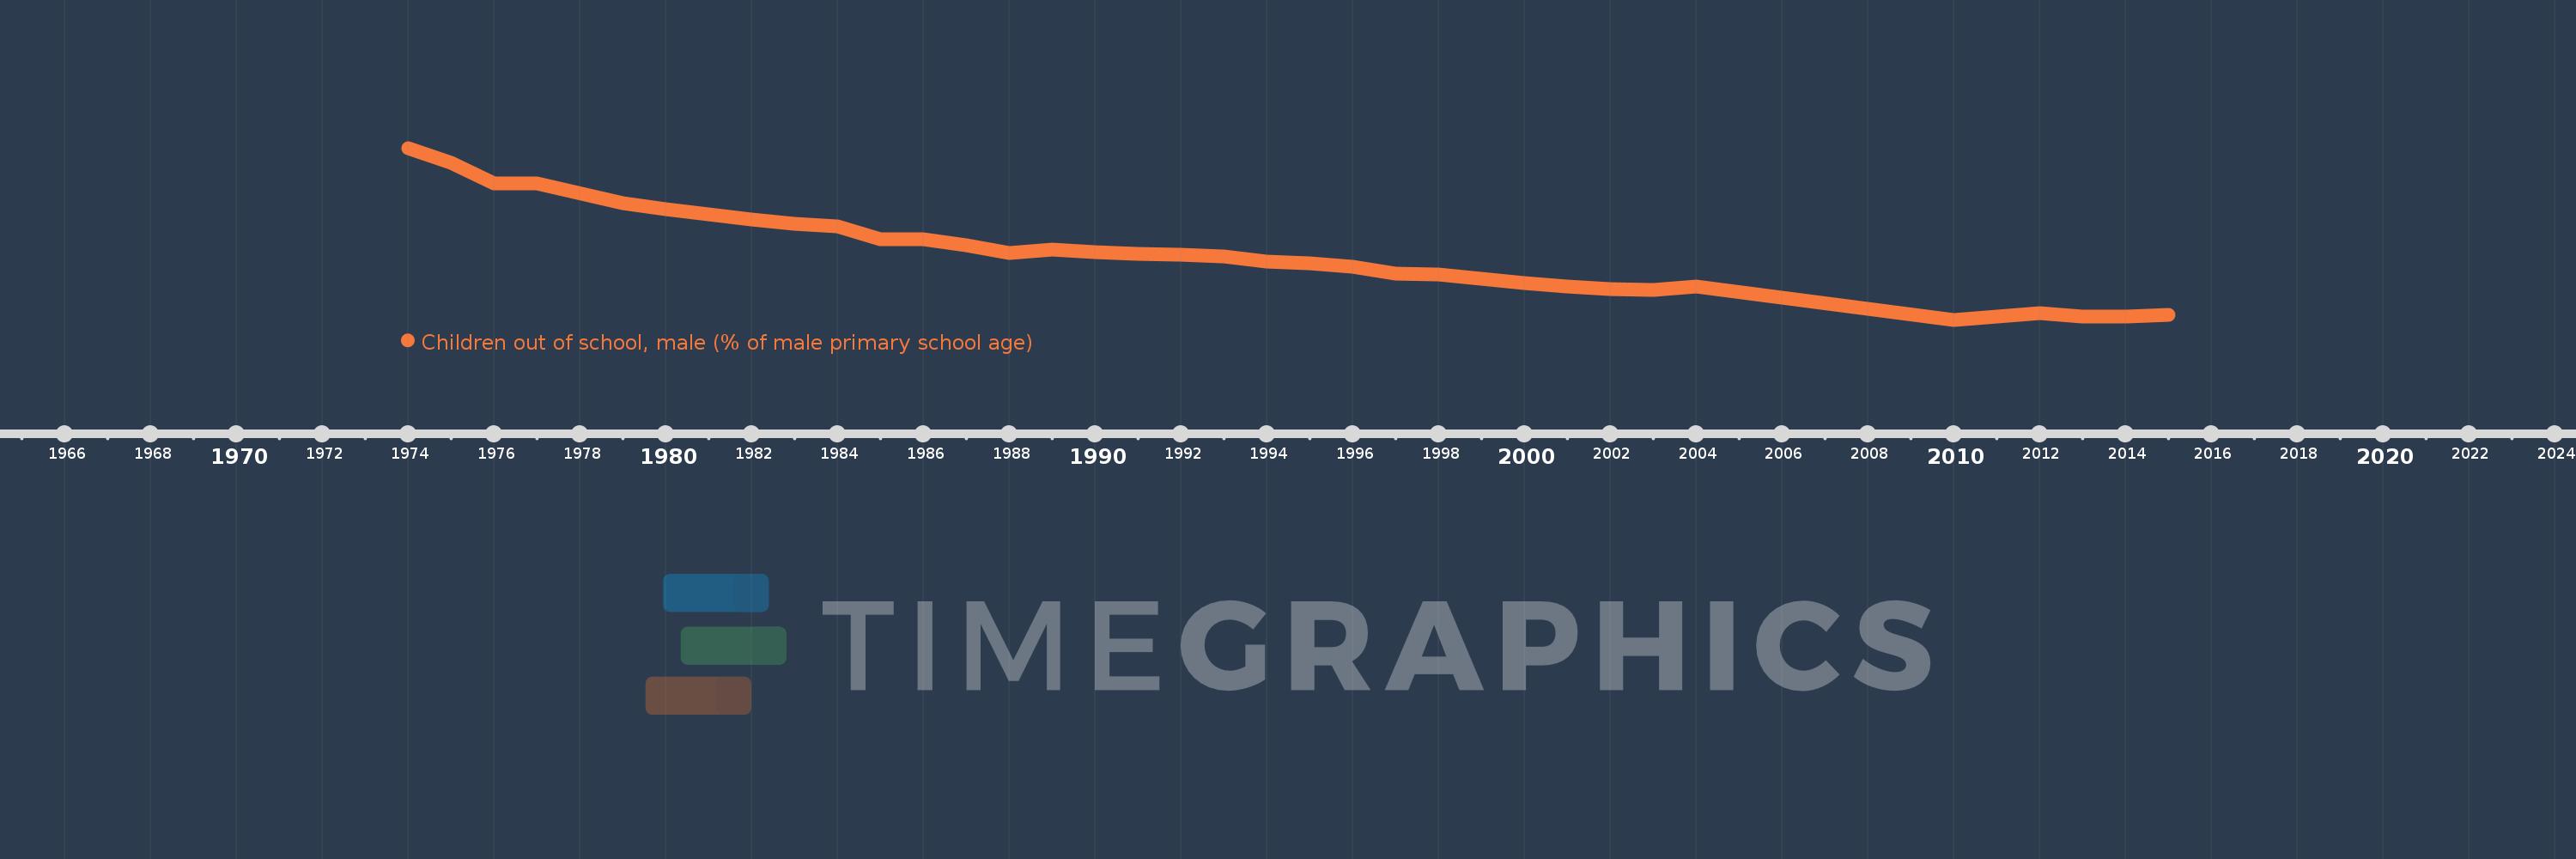
Children out of school, male (% of male primary school age)
2015,2014,2013,2012,2010,2004,2003,2002,2001,2000,1999,1998,1997,1996,1995,1994,1993,1992,1991,1990,1989,1988,1987,1986,1985,1984,1983,1982,1980,1979,1977,1976,1975,1974
This statistics in other country:
AfghanistanAlbaniaAlgeriaAngolaAntigua and BarbudaArab WorldArgentinaArmeniaArubaAustraliaAustriaAzerbaijanBahamas, TheBahrainBangladeshBarbadosBelarusBelgiumBelizeBeninBermudaBhutanBoliviaBosnia and HerzegovinaBotswanaBrazilBrunei DarussalamBulgariaBurkina FasoBurundiCabo VerdeCambodiaCameroonCanadaCaribbean small statesCentral African RepublicCentral Europe and the BalticsChadChileChinaColombiaComorosCongo, Dem. Rep.Congo, Rep.Costa RicaCote d'IvoireCroatiaCubaCyprusDenmarkDjiboutiDominicaDominican RepublicEarly-demographic dividendEast Asia & PacificEast Asia & Pacific (excluding high income)East Asia & Pacific (IDA & IBRD countries)EcuadorEgypt, Arab Rep.El SalvadorEquatorial GuineaEritreaEstoniaEthiopiaEuro areaEurope & Central AsiaEurope & Central Asia (excluding high income)Europe & Central Asia (IDA & IBRD countries)European UnionFijiFinlandFragile and conflict affected situationsFranceGabonGambia, TheGeorgiaGhanaGreeceGrenadaGuatemalaGuineaGuinea-BissauGuyanaHaitiHeavily indebted poor countries (HIPC)High incomeHondurasHong Kong SAR, ChinaHungaryIBRD onlyIcelandIDA & IBRD totalIDA blendIDA onlyIDA totalIndiaIndonesiaIran, Islamic Rep.IraqIrelandIsraelItalyJamaicaJapanJordanKazakhstanKenyaKiribatiKorea, Dem. People’s Rep.Korea, Rep.KuwaitKyrgyz RepublicLao PDRLate-demographic dividendLatin America & Caribbean Latin America & Caribbean (excluding high income)Latin America & the Caribbean (IDA & IBRD countries)LatviaLeast developed countries: UN classificationLebanonLesothoLiberiaLibyaLiechtensteinLithuaniaLow & middle incomeLow incomeLower middle incomeLuxembourgMacao SAR, ChinaMacedonia, FYRMadagascarMalawiMaldivesMaliMaltaMarshall IslandsMauritaniaMauritiusMexicoMicronesia, Fed. Sts.Middle East & North AfricaMiddle East & North Africa (excluding high income)Middle East & North Africa (IDA & IBRD countries)Middle incomeMoldovaMongoliaMontenegroMoroccoMozambiqueMyanmarNamibiaNauruNepalNetherlandsNew ZealandNicaraguaNigerNigeriaNorth AmericaNorwayOECD membersOmanOther small statesPacific island small statesPakistanPanamaPapua New GuineaParaguayPeruPhilippinesPolandPortugalPost-demographic dividendPre-demographic dividendPuerto RicoQatarRomaniaRussian FederationRwandaSamoaSan MarinoSao Tome and PrincipeSaudi ArabiaSenegalSerbiaSeychellesSierra LeoneSloveniaSmall statesSolomon IslandsSomaliaSouth AfricaSouth AsiaSouth Asia (IDA & IBRD)South SudanSpainSri LankaSt. Kitts and NevisSt. LuciaSt. Vincent and the GrenadinesSub-Saharan Africa Sub-Saharan Africa (excluding high income)Sub-Saharan Africa (IDA & IBRD countries)SudanSurinameSwazilandSwedenSwitzerlandSyrian Arab RepublicTajikistanTanzaniaThailandTimor-LesteTogoTongaTrinidad and TobagoTunisiaTurkeyTuvaluUgandaUkraineUnited Arab EmiratesUnited KingdomUnited StatesUpper middle incomeUruguayUzbekistanVanuatuVenezuela, RBWest Bank and GazaWorldYemen, Rep.ZambiaZimbabwe Timeline:
This timeline shows a graph from 1974 to 2015 of Oman. No data until 1973. Number of actual observations by date: 34.
Source name:
World Development Indicators
Source organization:
United Nations Educational, Scientific, and Cultural Organization (UNESCO) Institute for Statistics.
Categories, topics:
Education
Last updated:
apr 23, 2017
Indicators value changes by year
Maximum:
78.476
jan 1, 1974
At the date of observation
Value
Absolute change
Change from previous value
jan 1, 1974
78.476
+78.476
0.0%
jan 1, 1975
71.852
-6.624
-8.44%
jan 1, 1976
62.283
-9.569
-13.32%
jan 1, 1977
62.516
+0.232
0.37%
jan 1, 1979
53.333
-9.183
-14.69%
jan 1, 1980
50.685
-2.648
-4.96%
jan 1, 1982
46.18
-4.505
-8.89%
jan 1, 1983
44.147
-2.033
-4.4%
jan 1, 1984
43.073
-1.074
-2.43%
jan 1, 1985
37.093
-5.98
-13.88%
jan 1, 1986
36.99
-0.103
-0.28%
jan 1, 1987
34.162
-2.828
-7.64%
jan 1, 1988
30.879
-3.283
-9.61%
jan 1, 1989
32.181
+1.302
4.22%
jan 1, 1990
31.25
-0.931
-2.89%
jan 1, 1991
30.561
-0.689
-2.21%
jan 1, 1992
30.161
-0.4
-1.31%
jan 1, 1993
29.095
-1.065
-3.53%
jan 1, 1994
26.758
-2.337
-8.03%
jan 1, 1995
26.176
-0.582
-2.17%
jan 1, 1996
24.562
-1.614
-6.17%
jan 1, 1997
21.348
-3.214
-13.08%
jan 1, 1998
21.1
-0.248
-1.16%
jan 1, 1999
19.258
-1.842
-8.73%
jan 1, 2000
16.997
-2.262
-11.74%
jan 1, 2001
15.752
-1.245
-7.32%
jan 1, 2002
14.57
-1.182
-7.5%
jan 1, 2003
14.133
-0.437
-3.0%
jan 1, 2004
15.737
+1.604
11.35%
jan 1, 2010
0.498
-15.239
-96.83%
jan 1, 2012
3.443
+2.944
590.8%
jan 1, 2013
2.052
-1.39
-40.38%
jan 1, 2014
1.779
-0.273
-13.31%
jan 1, 2015
2.697
+0.918
51.59%
Ranking of countries by current statistics by years


Comments: