29
/
en
AIzaSyAYiBZKx7MnpbEhh9jyipgxe19OcubqV5w
April 1, 2024
33274
European Union
EUU
false
2
1
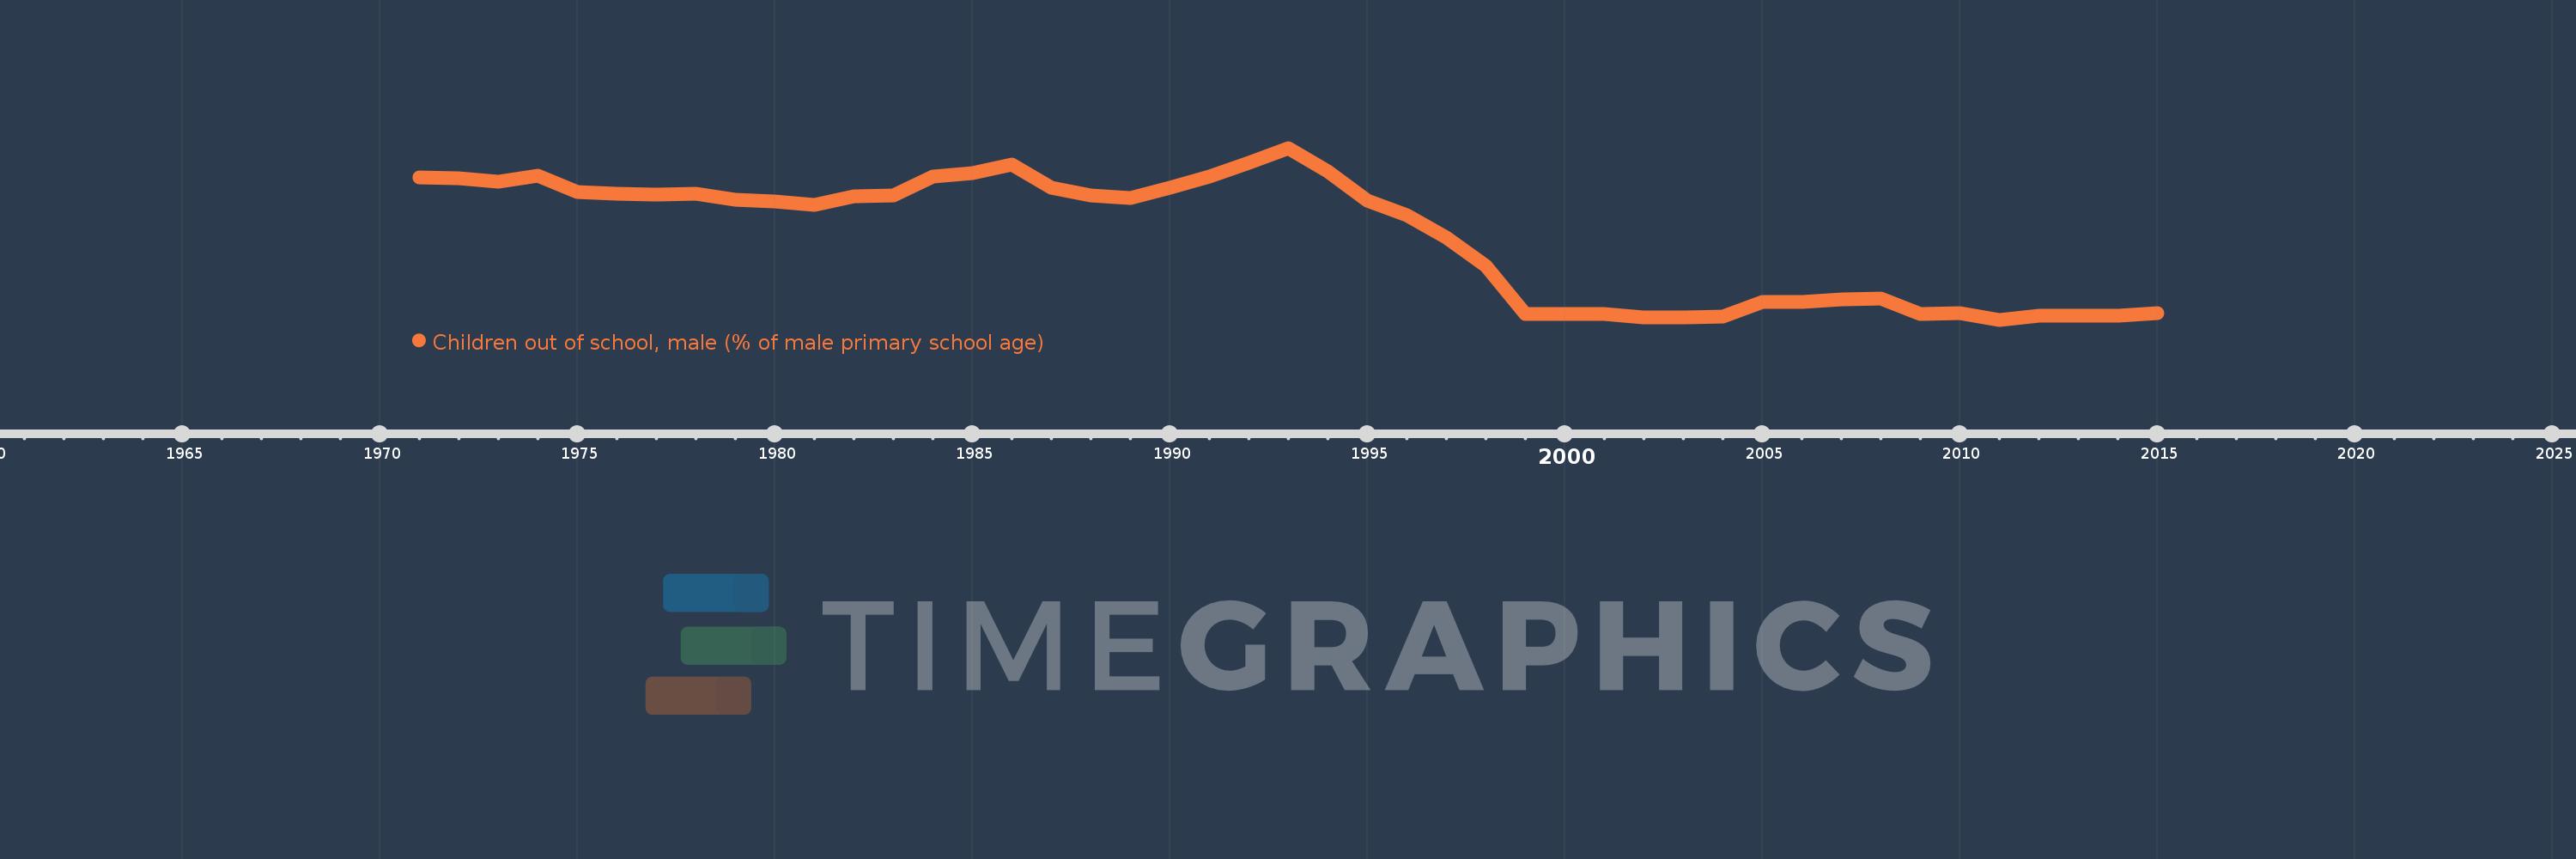
Children out of school, male (% of male primary school age)
2015,2014,2013,2012,2011,2010,2009,2008,2007,2006,2005,2004,2003,2002,2001,2000,1999,1998,1997,1996,1995,1994,1993,1992,1991,1990,1989,1988,1987,1986,1985,1984,1983,1982,1981,1980,1979,1978,1977,1976,1975,1974,1973,1972,1971
This statistics in other country:
AfghanistanAlbaniaAlgeriaAngolaAntigua and BarbudaArab WorldArgentinaArmeniaArubaAustraliaAustriaAzerbaijanBahamas, TheBahrainBangladeshBarbadosBelarusBelgiumBelizeBeninBermudaBhutanBoliviaBosnia and HerzegovinaBotswanaBrazilBrunei DarussalamBulgariaBurkina FasoBurundiCabo VerdeCambodiaCameroonCanadaCaribbean small statesCentral African RepublicCentral Europe and the BalticsChadChileChinaColombiaComorosCongo, Dem. Rep.Congo, Rep.Costa RicaCote d'IvoireCroatiaCubaCyprusDenmarkDjiboutiDominicaDominican RepublicEarly-demographic dividendEast Asia & PacificEast Asia & Pacific (excluding high income)East Asia & Pacific (IDA & IBRD countries)EcuadorEgypt, Arab Rep.El SalvadorEquatorial GuineaEritreaEstoniaEthiopiaEuro areaEurope & Central AsiaEurope & Central Asia (excluding high income)Europe & Central Asia (IDA & IBRD countries)European UnionFijiFinlandFragile and conflict affected situationsFranceGabonGambia, TheGeorgiaGhanaGreeceGrenadaGuatemalaGuineaGuinea-BissauGuyanaHaitiHeavily indebted poor countries (HIPC)High incomeHondurasHong Kong SAR, ChinaHungaryIBRD onlyIcelandIDA & IBRD totalIDA blendIDA onlyIDA totalIndiaIndonesiaIran, Islamic Rep.IraqIrelandIsraelItalyJamaicaJapanJordanKazakhstanKenyaKiribatiKorea, Dem. People’s Rep.Korea, Rep.KuwaitKyrgyz RepublicLao PDRLate-demographic dividendLatin America & Caribbean Latin America & Caribbean (excluding high income)Latin America & the Caribbean (IDA & IBRD countries)LatviaLeast developed countries: UN classificationLebanonLesothoLiberiaLibyaLiechtensteinLithuaniaLow & middle incomeLow incomeLower middle incomeLuxembourgMacao SAR, ChinaMacedonia, FYRMadagascarMalawiMaldivesMaliMaltaMarshall IslandsMauritaniaMauritiusMexicoMicronesia, Fed. Sts.Middle East & North AfricaMiddle East & North Africa (excluding high income)Middle East & North Africa (IDA & IBRD countries)Middle incomeMoldovaMongoliaMontenegroMoroccoMozambiqueMyanmarNamibiaNauruNepalNetherlandsNew ZealandNicaraguaNigerNigeriaNorth AmericaNorwayOECD membersOmanOther small statesPacific island small statesPakistanPanamaPapua New GuineaParaguayPeruPhilippinesPolandPortugalPost-demographic dividendPre-demographic dividendPuerto RicoQatarRomaniaRussian FederationRwandaSamoaSan MarinoSao Tome and PrincipeSaudi ArabiaSenegalSerbiaSeychellesSierra LeoneSloveniaSmall statesSolomon IslandsSomaliaSouth AfricaSouth AsiaSouth Asia (IDA & IBRD)South SudanSpainSri LankaSt. Kitts and NevisSt. LuciaSt. Vincent and the GrenadinesSub-Saharan Africa Sub-Saharan Africa (excluding high income)Sub-Saharan Africa (IDA & IBRD countries)SudanSurinameSwazilandSwedenSwitzerlandSyrian Arab RepublicTajikistanTanzaniaThailandTimor-LesteTogoTongaTrinidad and TobagoTunisiaTurkeyTuvaluUgandaUkraineUnited Arab EmiratesUnited KingdomUnited StatesUpper middle incomeUruguayUzbekistanVanuatuVenezuela, RBWest Bank and GazaWorldYemen, Rep.ZambiaZimbabwe Timeline:
This timeline shows a graph from 1971 to 2015 of European Union. No data until 1970. Number of actual observations by date: 45.
Source name:
World Development Indicators
Source organization:
United Nations Educational, Scientific, and Cultural Organization (UNESCO) Institute for Statistics.
Categories, topics:
Education
Last updated:
apr 23, 2017
Indicators value changes by year
At the date of observation
Value
Absolute change
Change from previous value
jan 1, 1971
4.666
+4.666
0.0%
jan 1, 1972
4.659
-0.007
-0.14%
jan 1, 1973
4.566
-0.093
-1.99%
jan 1, 1974
4.712
+0.146
3.19%
jan 1, 1975
4.33
-0.382
-8.11%
jan 1, 1976
4.288
-0.042
-0.98%
jan 1, 1977
4.267
-0.021
-0.49%
jan 1, 1978
4.287
+0.02
0.47%
jan 1, 1979
4.141
-0.146
-3.4%
jan 1, 1980
4.107
-0.034
-0.82%
jan 1, 1981
4.03
-0.077
-1.87%
jan 1, 1982
4.226
+0.196
4.86%
jan 1, 1983
4.255
+0.028
0.67%
jan 1, 1984
4.689
+0.435
10.22%
jan 1, 1985
4.767
+0.077
1.65%
jan 1, 1986
4.972
+0.205
4.31%
jan 1, 1987
4.427
-0.545
-10.96%
jan 1, 1988
4.254
-0.174
-3.92%
jan 1, 1989
4.181
-0.073
-1.71%
jan 1, 1990
4.425
+0.244
5.83%
jan 1, 1991
4.694
+0.269
6.08%
jan 1, 1992
5.008
+0.315
6.7%
jan 1, 1993
5.368
+0.36
7.18%
jan 1, 1994
4.805
-0.563
-10.5%
jan 1, 1995
4.131
-0.674
-14.03%
jan 1, 1996
3.781
-0.349
-8.46%
jan 1, 1997
3.257
-0.525
-13.87%
jan 1, 1998
2.582
-0.675
-20.73%
jan 1, 1999
1.44
-1.142
-44.22%
jan 1, 2000
1.456
+0.016
1.13%
jan 1, 2001
1.449
-0.007
-0.51%
jan 1, 2002
1.376
-0.073
-5.02%
jan 1, 2003
1.374
-0.002
-0.13%
jan 1, 2004
1.387
+0.012
0.88%
jan 1, 2005
1.735
+0.349
25.16%
jan 1, 2006
1.728
-0.007
-0.42%
jan 1, 2007
1.792
+0.064
3.71%
jan 1, 2008
1.818
+0.025
1.42%
jan 1, 2009
1.443
-0.375
-20.61%
jan 1, 2010
1.471
+0.027
1.9%
jan 1, 2011
1.312
-0.159
-10.8%
jan 1, 2012
1.401
+0.089
6.78%
jan 1, 2013
1.403
+0.002
0.17%
jan 1, 2014
1.399
-0.004
-0.32%
jan 1, 2015
1.474
+0.075
5.37%
Ranking of countries by current statistics by years


Comments: