29
/
en
AIzaSyAYiBZKx7MnpbEhh9jyipgxe19OcubqV5w
April 1, 2024
201320
Morocco
MAR
true
2
1
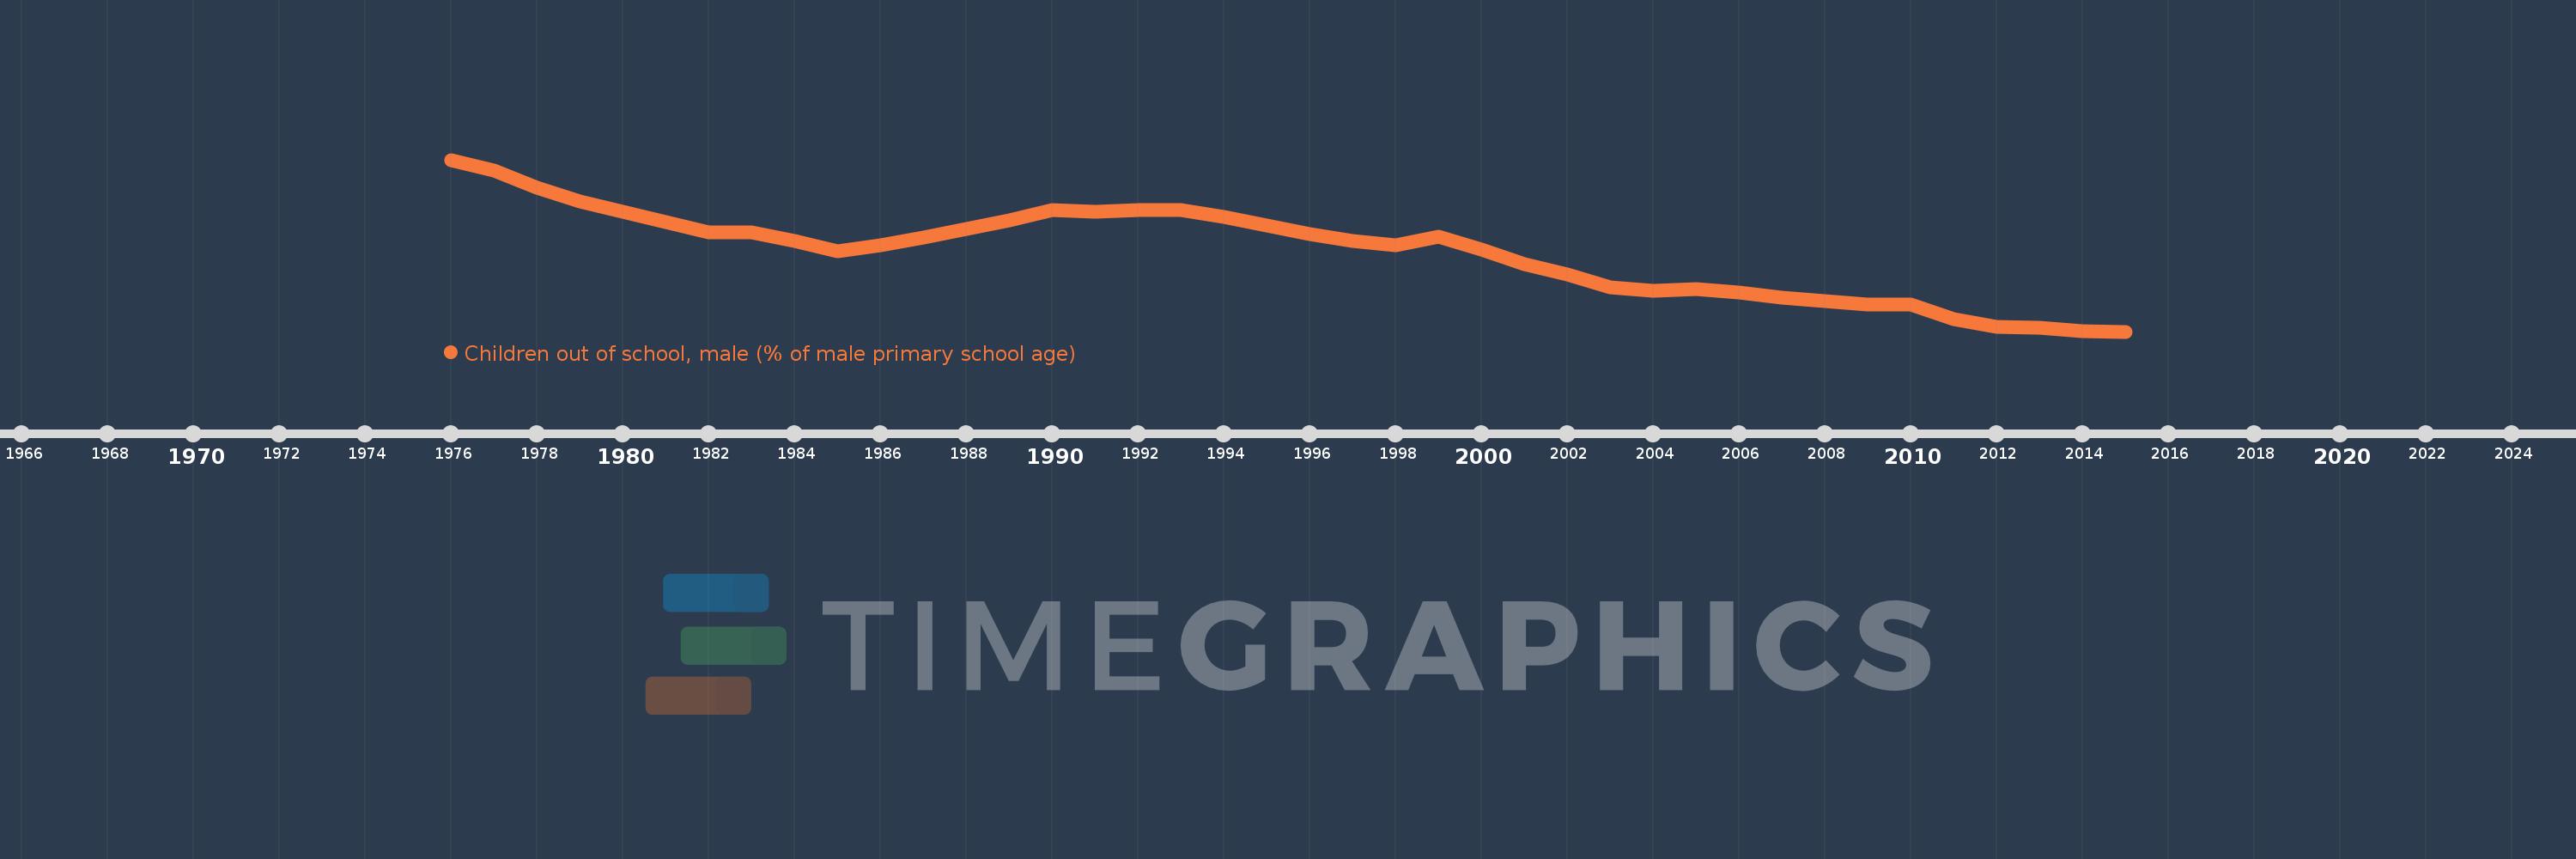
Children out of school, male (% of male primary school age)
2015,2014,2013,2012,2011,2010,2009,2008,2007,2006,2005,2004,2003,2002,2001,2000,1999,1998,1997,1996,1995,1994,1993,1992,1991,1990,1989,1988,1987,1986,1985,1984,1983,1982,1981,1980,1979,1978,1977,1976
This statistics in other country:
AfghanistanAlbaniaAlgeriaAngolaAntigua and BarbudaArab WorldArgentinaArmeniaArubaAustraliaAustriaAzerbaijanBahamas, TheBahrainBangladeshBarbadosBelarusBelgiumBelizeBeninBermudaBhutanBoliviaBosnia and HerzegovinaBotswanaBrazilBrunei DarussalamBulgariaBurkina FasoBurundiCabo VerdeCambodiaCameroonCanadaCaribbean small statesCentral African RepublicCentral Europe and the BalticsChadChileChinaColombiaComorosCongo, Dem. Rep.Congo, Rep.Costa RicaCote d'IvoireCroatiaCubaCyprusDenmarkDjiboutiDominicaDominican RepublicEarly-demographic dividendEast Asia & PacificEast Asia & Pacific (excluding high income)East Asia & Pacific (IDA & IBRD countries)EcuadorEgypt, Arab Rep.El SalvadorEquatorial GuineaEritreaEstoniaEthiopiaEuro areaEurope & Central AsiaEurope & Central Asia (excluding high income)Europe & Central Asia (IDA & IBRD countries)European UnionFijiFinlandFragile and conflict affected situationsFranceGabonGambia, TheGeorgiaGhanaGreeceGrenadaGuatemalaGuineaGuinea-BissauGuyanaHaitiHeavily indebted poor countries (HIPC)High incomeHondurasHong Kong SAR, ChinaHungaryIBRD onlyIcelandIDA & IBRD totalIDA blendIDA onlyIDA totalIndiaIndonesiaIran, Islamic Rep.IraqIrelandIsraelItalyJamaicaJapanJordanKazakhstanKenyaKiribatiKorea, Dem. People’s Rep.Korea, Rep.KuwaitKyrgyz RepublicLao PDRLate-demographic dividendLatin America & Caribbean Latin America & Caribbean (excluding high income)Latin America & the Caribbean (IDA & IBRD countries)LatviaLeast developed countries: UN classificationLebanonLesothoLiberiaLibyaLiechtensteinLithuaniaLow & middle incomeLow incomeLower middle incomeLuxembourgMacao SAR, ChinaMacedonia, FYRMadagascarMalawiMaldivesMaliMaltaMarshall IslandsMauritaniaMauritiusMexicoMicronesia, Fed. Sts.Middle East & North AfricaMiddle East & North Africa (excluding high income)Middle East & North Africa (IDA & IBRD countries)Middle incomeMoldovaMongoliaMontenegroMoroccoMozambiqueMyanmarNamibiaNauruNepalNetherlandsNew ZealandNicaraguaNigerNigeriaNorth AmericaNorwayOECD membersOmanOther small statesPacific island small statesPakistanPanamaPapua New GuineaParaguayPeruPhilippinesPolandPortugalPost-demographic dividendPre-demographic dividendPuerto RicoQatarRomaniaRussian FederationRwandaSamoaSan MarinoSao Tome and PrincipeSaudi ArabiaSenegalSerbiaSeychellesSierra LeoneSloveniaSmall statesSolomon IslandsSomaliaSouth AfricaSouth AsiaSouth Asia (IDA & IBRD)South SudanSpainSri LankaSt. Kitts and NevisSt. LuciaSt. Vincent and the GrenadinesSub-Saharan Africa Sub-Saharan Africa (excluding high income)Sub-Saharan Africa (IDA & IBRD countries)SudanSurinameSwazilandSwedenSwitzerlandSyrian Arab RepublicTajikistanTanzaniaThailandTimor-LesteTogoTongaTrinidad and TobagoTunisiaTurkeyTuvaluUgandaUkraineUnited Arab EmiratesUnited KingdomUnited StatesUpper middle incomeUruguayUzbekistanVanuatuVenezuela, RBWest Bank and GazaWorldYemen, Rep.ZambiaZimbabwe Timeline:
This timeline shows a graph from 1976 to 2015 of Morocco. No data until 1975. Number of actual observations by date: 40.
Source name:
World Development Indicators
Source organization:
United Nations Educational, Scientific, and Cultural Organization (UNESCO) Institute for Statistics.
Categories, topics:
Education
Last updated:
apr 23, 2017
Indicators value changes by year
Maximum:
48.936
jan 1, 1976
At the date of observation
Value
Absolute change
Change from previous value
jan 1, 1976
48.936
+48.936
0.0%
jan 1, 1977
46.024
-2.912
-5.95%
jan 1, 1978
41.149
-4.876
-10.59%
jan 1, 1979
37.258
-3.891
-9.46%
jan 1, 1980
34.506
-2.752
-7.39%
jan 1, 1981
31.502
-3.004
-8.71%
jan 1, 1982
28.651
-2.851
-9.05%
jan 1, 1983
28.733
+0.082
0.29%
jan 1, 1984
26.376
-2.357
-8.2%
jan 1, 1985
23.443
-2.933
-11.12%
jan 1, 1986
25.085
+1.642
7.0%
jan 1, 1987
27.202
+2.117
8.44%
jan 1, 1988
29.729
+2.527
9.29%
jan 1, 1989
32.012
+2.283
7.68%
jan 1, 1990
34.796
+2.785
8.7%
jan 1, 1991
34.351
-0.446
-1.28%
jan 1, 1992
35.001
+0.65
1.89%
jan 1, 1993
34.916
-0.084
-0.24%
jan 1, 1994
32.923
-1.993
-5.71%
jan 1, 1995
30.66
-2.263
-6.87%
jan 1, 1996
28.174
-2.486
-8.11%
jan 1, 1997
26.273
-1.901
-6.75%
jan 1, 1998
25.13
-1.143
-4.35%
jan 1, 1999
27.589
+2.459
9.78%
jan 1, 2000
23.793
-3.796
-13.76%
jan 1, 2001
19.865
-3.928
-16.51%
jan 1, 2002
16.94
-2.924
-14.72%
jan 1, 2003
13.298
-3.643
-21.5%
jan 1, 2004
12.43
-0.868
-6.52%
jan 1, 2005
12.794
+0.364
2.93%
jan 1, 2006
11.801
-0.993
-7.76%
jan 1, 2007
10.503
-1.299
-11.01%
jan 1, 2008
9.364
-1.139
-10.84%
jan 1, 2009
8.489
-0.875
-9.35%
jan 1, 2010
8.494
+0.006
0.07%
jan 1, 2011
4.529
-3.965
-46.68%
jan 1, 2012
2.396
-2.133
-47.09%
jan 1, 2013
1.982
-0.415
-17.3%
jan 1, 2014
1.054
-0.927
-46.79%
jan 1, 2015
0.966
-0.088
-8.37%
Ranking of countries by current statistics by years


Comments: