29
/
en
AIzaSyAYiBZKx7MnpbEhh9jyipgxe19OcubqV5w
April 1, 2024
60599
Sub-Saharan Africa (IDA & IBRD countries)
TSS
false
2
1
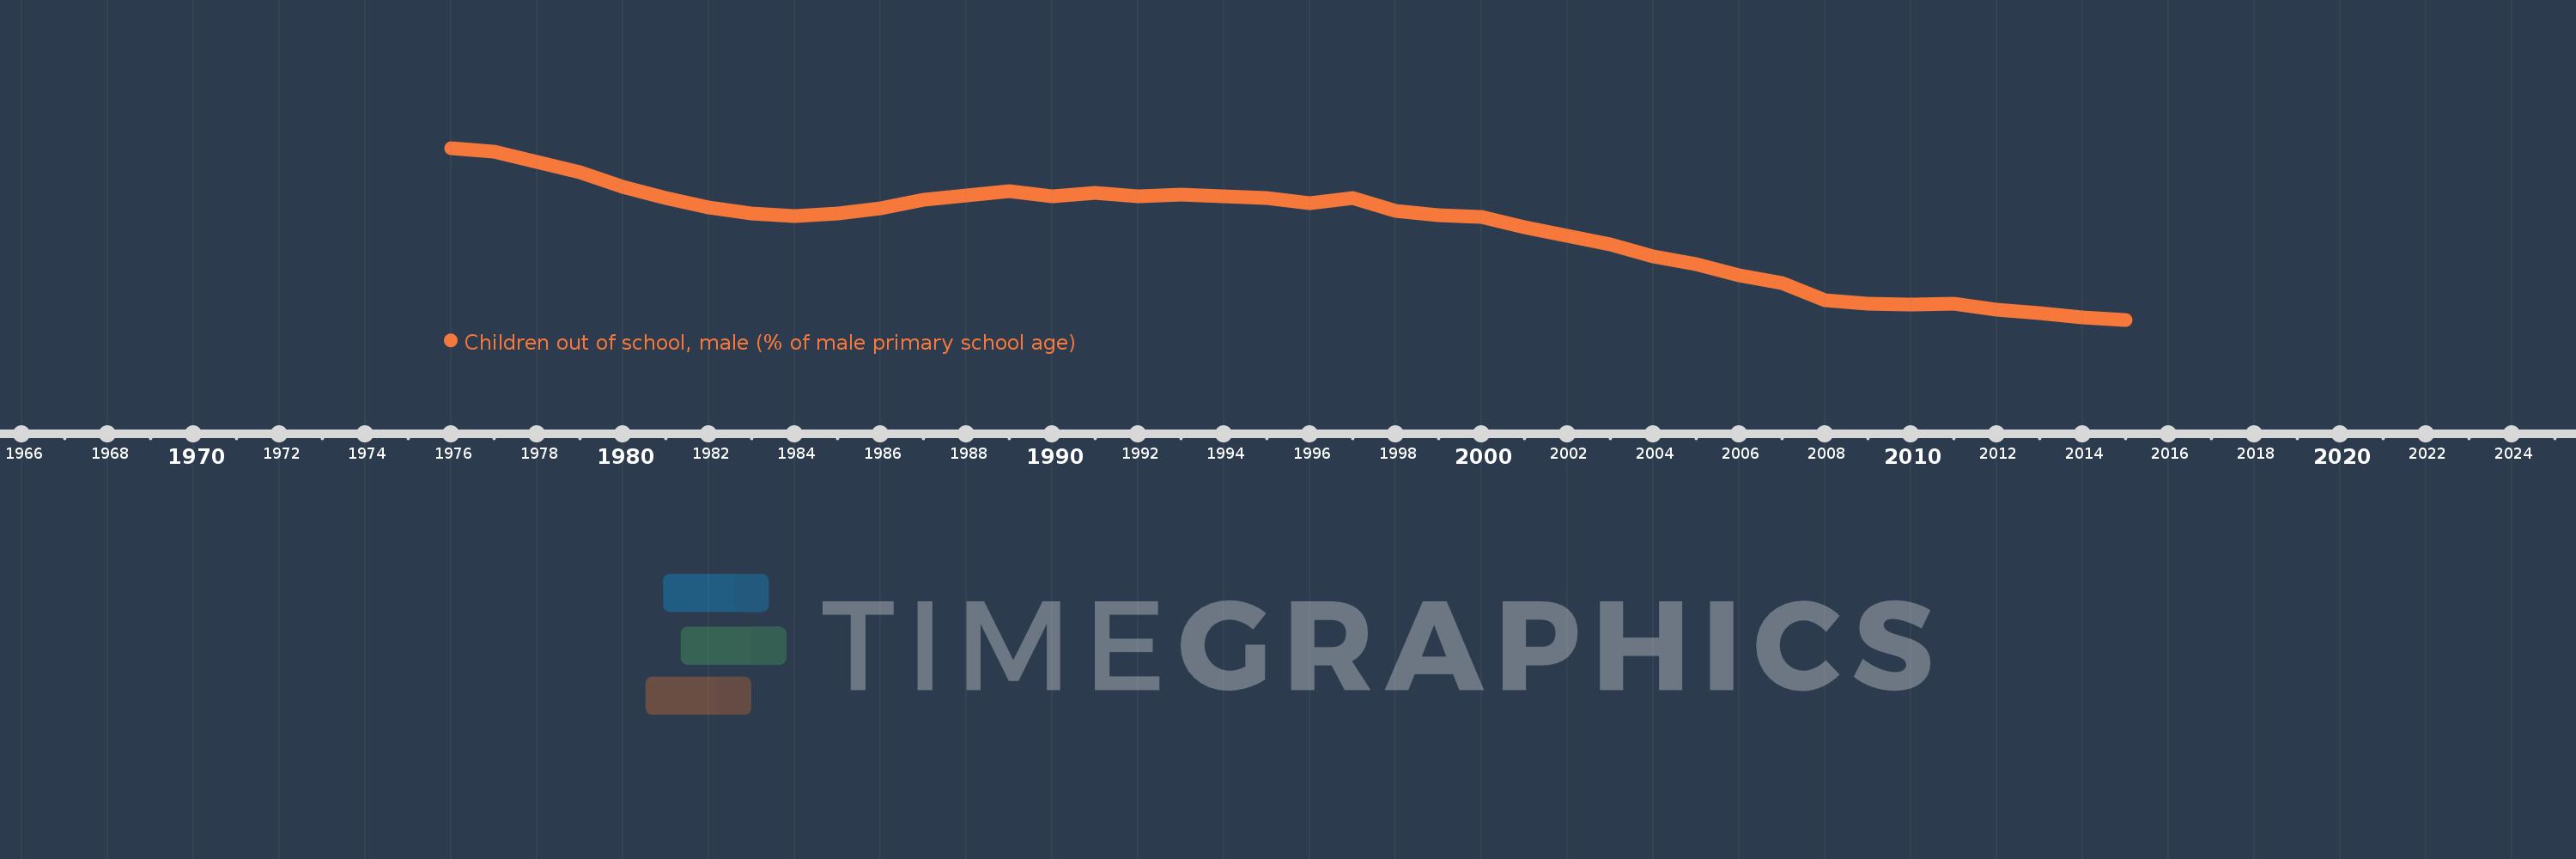
Children out of school, male (% of male primary school age)
2015,2014,2013,2012,2011,2010,2009,2008,2007,2006,2005,2004,2003,2002,2001,2000,1999,1998,1997,1996,1995,1994,1993,1992,1991,1990,1989,1988,1987,1986,1985,1984,1983,1982,1981,1980,1979,1978,1977,1976
This statistics in other country:
AfghanistanAlbaniaAlgeriaAngolaAntigua and BarbudaArab WorldArgentinaArmeniaArubaAustraliaAustriaAzerbaijanBahamas, TheBahrainBangladeshBarbadosBelarusBelgiumBelizeBeninBermudaBhutanBoliviaBosnia and HerzegovinaBotswanaBrazilBrunei DarussalamBulgariaBurkina FasoBurundiCabo VerdeCambodiaCameroonCanadaCaribbean small statesCentral African RepublicCentral Europe and the BalticsChadChileChinaColombiaComorosCongo, Dem. Rep.Congo, Rep.Costa RicaCote d'IvoireCroatiaCubaCyprusDenmarkDjiboutiDominicaDominican RepublicEarly-demographic dividendEast Asia & PacificEast Asia & Pacific (excluding high income)East Asia & Pacific (IDA & IBRD countries)EcuadorEgypt, Arab Rep.El SalvadorEquatorial GuineaEritreaEstoniaEthiopiaEuro areaEurope & Central AsiaEurope & Central Asia (excluding high income)Europe & Central Asia (IDA & IBRD countries)European UnionFijiFinlandFragile and conflict affected situationsFranceGabonGambia, TheGeorgiaGhanaGreeceGrenadaGuatemalaGuineaGuinea-BissauGuyanaHaitiHeavily indebted poor countries (HIPC)High incomeHondurasHong Kong SAR, ChinaHungaryIBRD onlyIcelandIDA & IBRD totalIDA blendIDA onlyIDA totalIndiaIndonesiaIran, Islamic Rep.IraqIrelandIsraelItalyJamaicaJapanJordanKazakhstanKenyaKiribatiKorea, Dem. People’s Rep.Korea, Rep.KuwaitKyrgyz RepublicLao PDRLate-demographic dividendLatin America & Caribbean Latin America & Caribbean (excluding high income)Latin America & the Caribbean (IDA & IBRD countries)LatviaLeast developed countries: UN classificationLebanonLesothoLiberiaLibyaLiechtensteinLithuaniaLow & middle incomeLow incomeLower middle incomeLuxembourgMacao SAR, ChinaMacedonia, FYRMadagascarMalawiMaldivesMaliMaltaMarshall IslandsMauritaniaMauritiusMexicoMicronesia, Fed. Sts.Middle East & North AfricaMiddle East & North Africa (excluding high income)Middle East & North Africa (IDA & IBRD countries)Middle incomeMoldovaMongoliaMontenegroMoroccoMozambiqueMyanmarNamibiaNauruNepalNetherlandsNew ZealandNicaraguaNigerNigeriaNorth AmericaNorwayOECD membersOmanOther small statesPacific island small statesPakistanPanamaPapua New GuineaParaguayPeruPhilippinesPolandPortugalPost-demographic dividendPre-demographic dividendPuerto RicoQatarRomaniaRussian FederationRwandaSamoaSan MarinoSao Tome and PrincipeSaudi ArabiaSenegalSerbiaSeychellesSierra LeoneSloveniaSmall statesSolomon IslandsSomaliaSouth AfricaSouth AsiaSouth Asia (IDA & IBRD)South SudanSpainSri LankaSt. Kitts and NevisSt. LuciaSt. Vincent and the GrenadinesSub-Saharan Africa Sub-Saharan Africa (excluding high income)Sub-Saharan Africa (IDA & IBRD countries)SudanSurinameSwazilandSwedenSwitzerlandSyrian Arab RepublicTajikistanTanzaniaThailandTimor-LesteTogoTongaTrinidad and TobagoTunisiaTurkeyTuvaluUgandaUkraineUnited Arab EmiratesUnited KingdomUnited StatesUpper middle incomeUruguayUzbekistanVanuatuVenezuela, RBWest Bank and GazaWorldYemen, Rep.ZambiaZimbabwe Timeline:
This timeline shows a graph from 1976 to 2015 of Sub-Saharan Africa (IDA & IBRD countries). No data until 1975. Number of actual observations by date: 40.
Source name:
World Development Indicators
Source organization:
United Nations Educational, Scientific, and Cultural Organization (UNESCO) Institute for Statistics.
Categories, topics:
Education
Last updated:
apr 23, 2017
Indicators value changes by year
Maximum:
50.853
jan 1, 1976
At the date of observation
Value
Absolute change
Change from previous value
jan 1, 1976
50.853
+50.853
0.0%
jan 1, 1977
50.113
-0.74
-1.46%
jan 1, 1978
48.297
-1.816
-3.62%
jan 1, 1979
46.344
-1.953
-4.04%
jan 1, 1980
43.699
-2.645
-5.71%
jan 1, 1981
41.667
-2.033
-4.65%
jan 1, 1982
39.827
-1.84
-4.41%
jan 1, 1983
38.707
-1.12
-2.81%
jan 1, 1984
38.235
-0.472
-1.22%
jan 1, 1985
38.755
+0.52
1.36%
jan 1, 1986
39.767
+1.012
2.61%
jan 1, 1987
41.246
+1.48
3.72%
jan 1, 1988
42.108
+0.861
2.09%
jan 1, 1989
42.849
+0.741
1.76%
jan 1, 1990
41.989
-0.86
-2.01%
jan 1, 1991
42.633
+0.643
1.53%
jan 1, 1992
41.884
-0.748
-1.75%
jan 1, 1993
42.272
+0.388
0.93%
jan 1, 1994
41.957
-0.315
-0.75%
jan 1, 1995
41.659
-0.298
-0.71%
jan 1, 1996
40.638
-1.021
-2.45%
jan 1, 1997
41.568
+0.93
2.29%
jan 1, 1998
39.222
-2.345
-5.64%
jan 1, 1999
38.433
-0.789
-2.01%
jan 1, 2000
38.225
-0.208
-0.54%
jan 1, 2001
36.172
-2.053
-5.37%
jan 1, 2002
34.611
-1.562
-4.32%
jan 1, 2003
33.111
-1.499
-4.33%
jan 1, 2004
30.908
-2.204
-6.66%
jan 1, 2005
29.482
-1.425
-4.61%
jan 1, 2006
27.389
-2.093
-7.1%
jan 1, 2007
26.015
-1.374
-5.02%
jan 1, 2008
22.803
-3.212
-12.35%
jan 1, 2009
22.148
-0.656
-2.88%
jan 1, 2010
21.998
-0.15
-0.68%
jan 1, 2011
22.216
+0.218
0.99%
jan 1, 2012
21.04
-1.177
-5.3%
jan 1, 2013
20.387
-0.653
-3.1%
jan 1, 2014
19.657
-0.73
-3.58%
jan 1, 2015
19.21
-0.447
-2.27%
Ranking of countries by current statistics by years


Comments: