29
/
en
AIzaSyAYiBZKx7MnpbEhh9jyipgxe19OcubqV5w
April 1, 2024
45650
Low & middle income
LMY
false
2
1
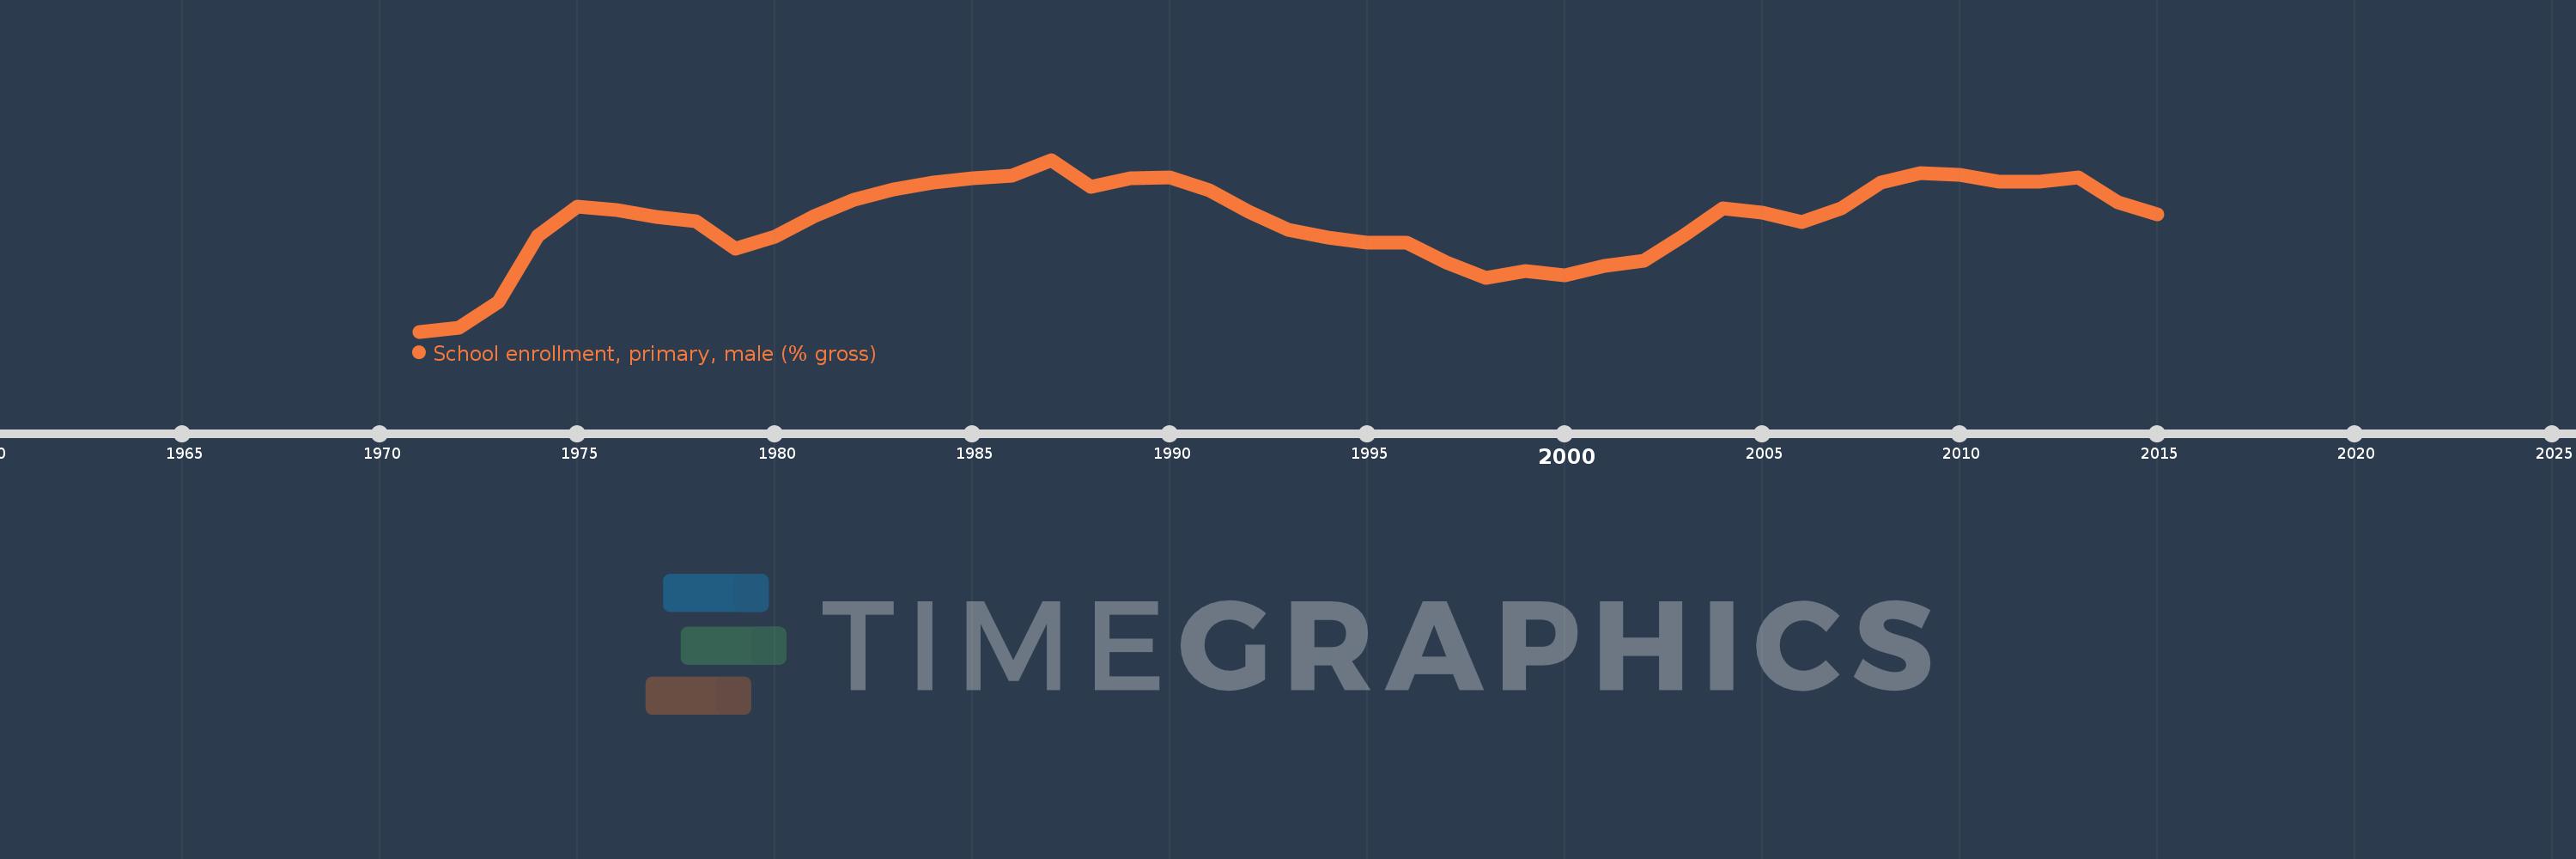
School enrollment, primary, male (% gross)
2015,2014,2013,2012,2011,2010,2009,2008,2007,2006,2005,2004,2003,2002,2001,2000,1999,1998,1997,1996,1995,1994,1993,1992,1991,1990,1989,1988,1987,1986,1985,1984,1983,1982,1981,1980,1979,1978,1977,1976,1975,1974,1973,1972,1971
This statistics in other country:
AfghanistanAlbaniaAlgeriaAndorraAngolaAntigua and BarbudaArab WorldArgentinaArmeniaArubaAustraliaAustriaAzerbaijanBahamas, TheBahrainBangladeshBarbadosBelarusBelgiumBelizeBeninBermudaBhutanBoliviaBosnia and HerzegovinaBotswanaBrazilBrunei DarussalamBulgariaBurkina FasoBurundiCabo VerdeCambodiaCameroonCanadaCaribbean small statesCentral African RepublicCentral Europe and the BalticsChadChileChinaColombiaComorosCongo, Dem. Rep.Congo, Rep.Costa RicaCote d'IvoireCroatiaCubaCuracaoCyprusCzech RepublicDenmarkDjiboutiDominicaDominican RepublicEarly-demographic dividendEast Asia & PacificEast Asia & Pacific (excluding high income)East Asia & Pacific (IDA & IBRD countries)EcuadorEgypt, Arab Rep.El SalvadorEquatorial GuineaEritreaEstoniaEthiopiaEuro areaEurope & Central AsiaEurope & Central Asia (excluding high income)Europe & Central Asia (IDA & IBRD countries)European UnionFijiFinlandFragile and conflict affected situationsFranceGabonGambia, TheGeorgiaGermanyGhanaGreeceGrenadaGuatemalaGuineaGuinea-BissauGuyanaHaitiHeavily indebted poor countries (HIPC)High incomeHondurasHong Kong SAR, ChinaHungaryIBRD onlyIcelandIDA & IBRD totalIDA blendIDA onlyIDA totalIndiaIndonesiaIran, Islamic Rep.IraqIrelandIsraelItalyJamaicaJapanJordanKazakhstanKenyaKiribatiKorea, Dem. People’s Rep.Korea, Rep.KuwaitKyrgyz RepublicLao PDRLate-demographic dividendLatin America & Caribbean Latin America & Caribbean (excluding high income)Latin America & the Caribbean (IDA & IBRD countries)LatviaLeast developed countries: UN classificationLebanonLesothoLiberiaLibyaLiechtensteinLithuaniaLow & middle incomeLow incomeLower middle incomeLuxembourgMacao SAR, ChinaMacedonia, FYRMadagascarMalawiMaldivesMaliMaltaMarshall IslandsMauritaniaMauritiusMexicoMicronesia, Fed. Sts.Middle East & North AfricaMiddle East & North Africa (excluding high income)Middle East & North Africa (IDA & IBRD countries)Middle incomeMoldovaMongoliaMontenegroMoroccoMozambiqueMyanmarNamibiaNauruNepalNetherlandsNew ZealandNicaraguaNigerNigeriaNorth AmericaNorwayOECD membersOmanOther small statesPacific island small statesPakistanPalauPanamaPapua New GuineaParaguayPeruPhilippinesPolandPortugalPost-demographic dividendPre-demographic dividendPuerto RicoQatarRomaniaRussian FederationRwandaSamoaSan MarinoSao Tome and PrincipeSaudi ArabiaSenegalSerbiaSeychellesSierra LeoneSlovak RepublicSloveniaSmall statesSolomon IslandsSomaliaSouth AfricaSouth AsiaSouth Asia (IDA & IBRD)South SudanSpainSri LankaSt. Kitts and NevisSt. LuciaSt. Vincent and the GrenadinesSub-Saharan Africa Sub-Saharan Africa (excluding high income)Sub-Saharan Africa (IDA & IBRD countries)SudanSurinameSwazilandSwedenSwitzerlandSyrian Arab RepublicTajikistanTanzaniaThailandTimor-LesteTogoTongaTrinidad and TobagoTunisiaTurkeyTurkmenistanTuvaluUgandaUkraineUnited Arab EmiratesUnited KingdomUnited StatesUpper middle incomeUruguayUzbekistanVanuatuVenezuela, RBVietnamWest Bank and GazaWorldYemen, Rep.ZambiaZimbabwe Timeline:
This timeline shows a graph from 1971 to 2015 of Low & middle income. No data until 1970. Number of actual observations by date: 45.
Source name:
World Development Indicators
Source organization:
United Nations Educational, Scientific, and Cultural Organization (UNESCO) Institute for Statistics.
Categories, topics:
Education, Gender
Last updated:
apr 23, 2017
Indicators value changes by year
Minimum:
98.492
jan 1, 1971
Maximum:
108.462
jan 1, 1987
At the date of observation
Value
Absolute change
Change from previous value
jan 1, 1971
98.492
+98.492
0.0%
jan 1, 1972
98.706
+0.214
0.22%
jan 1, 1973
100.195
+1.489
1.51%
jan 1, 1974
104.058
+3.863
3.86%
jan 1, 1975
105.75
+1.692
1.63%
jan 1, 1976
105.53
-0.221
-0.21%
jan 1, 1977
105.158
-0.371
-0.35%
jan 1, 1978
104.903
-0.255
-0.24%
jan 1, 1979
103.287
-1.616
-1.54%
jan 1, 1980
104.015
+0.728
0.7%
jan 1, 1981
105.181
+1.166
1.12%
jan 1, 1982
106.163
+0.982
0.93%
jan 1, 1983
106.761
+0.598
0.56%
jan 1, 1984
107.151
+0.389
0.36%
jan 1, 1985
107.401
+0.251
0.23%
jan 1, 1986
107.544
+0.143
0.13%
jan 1, 1987
108.462
+0.918
0.85%
jan 1, 1988
106.915
-1.547
-1.43%
jan 1, 1989
107.385
+0.47
0.44%
jan 1, 1990
107.447
+0.061
0.06%
jan 1, 1991
106.691
-0.756
-0.7%
jan 1, 1992
105.444
-1.247
-1.17%
jan 1, 1993
104.389
-1.055
-1.0%
jan 1, 1994
103.97
-0.419
-0.4%
jan 1, 1995
103.662
-0.308
-0.3%
jan 1, 1996
103.629
-0.033
-0.03%
jan 1, 1997
102.492
-1.137
-1.1%
jan 1, 1998
101.626
-0.866
-0.85%
jan 1, 1999
101.989
+0.363
0.36%
jan 1, 2000
101.77
-0.219
-0.21%
jan 1, 2001
102.289
+0.519
0.51%
jan 1, 2002
102.61
+0.321
0.31%
jan 1, 2003
104.056
+1.445
1.41%
jan 1, 2004
105.625
+1.569
1.51%
jan 1, 2005
105.391
-0.234
-0.22%
jan 1, 2006
104.826
-0.564
-0.54%
jan 1, 2007
105.638
+0.812
0.77%
jan 1, 2008
107.151
+1.513
1.43%
jan 1, 2009
107.7
+0.548
0.51%
jan 1, 2010
107.581
-0.119
-0.11%
jan 1, 2011
107.178
-0.403
-0.37%
jan 1, 2012
107.201
+0.023
0.02%
jan 1, 2013
107.45
+0.249
0.23%
jan 1, 2014
106.009
-1.442
-1.34%
jan 1, 2015
105.308
-0.7
-0.66%
Ranking of countries by current statistics by years


Comments: