29
/
en
AIzaSyAYiBZKx7MnpbEhh9jyipgxe19OcubqV5w
April 1, 2024
208417
Netherlands
NLD
true
2
1
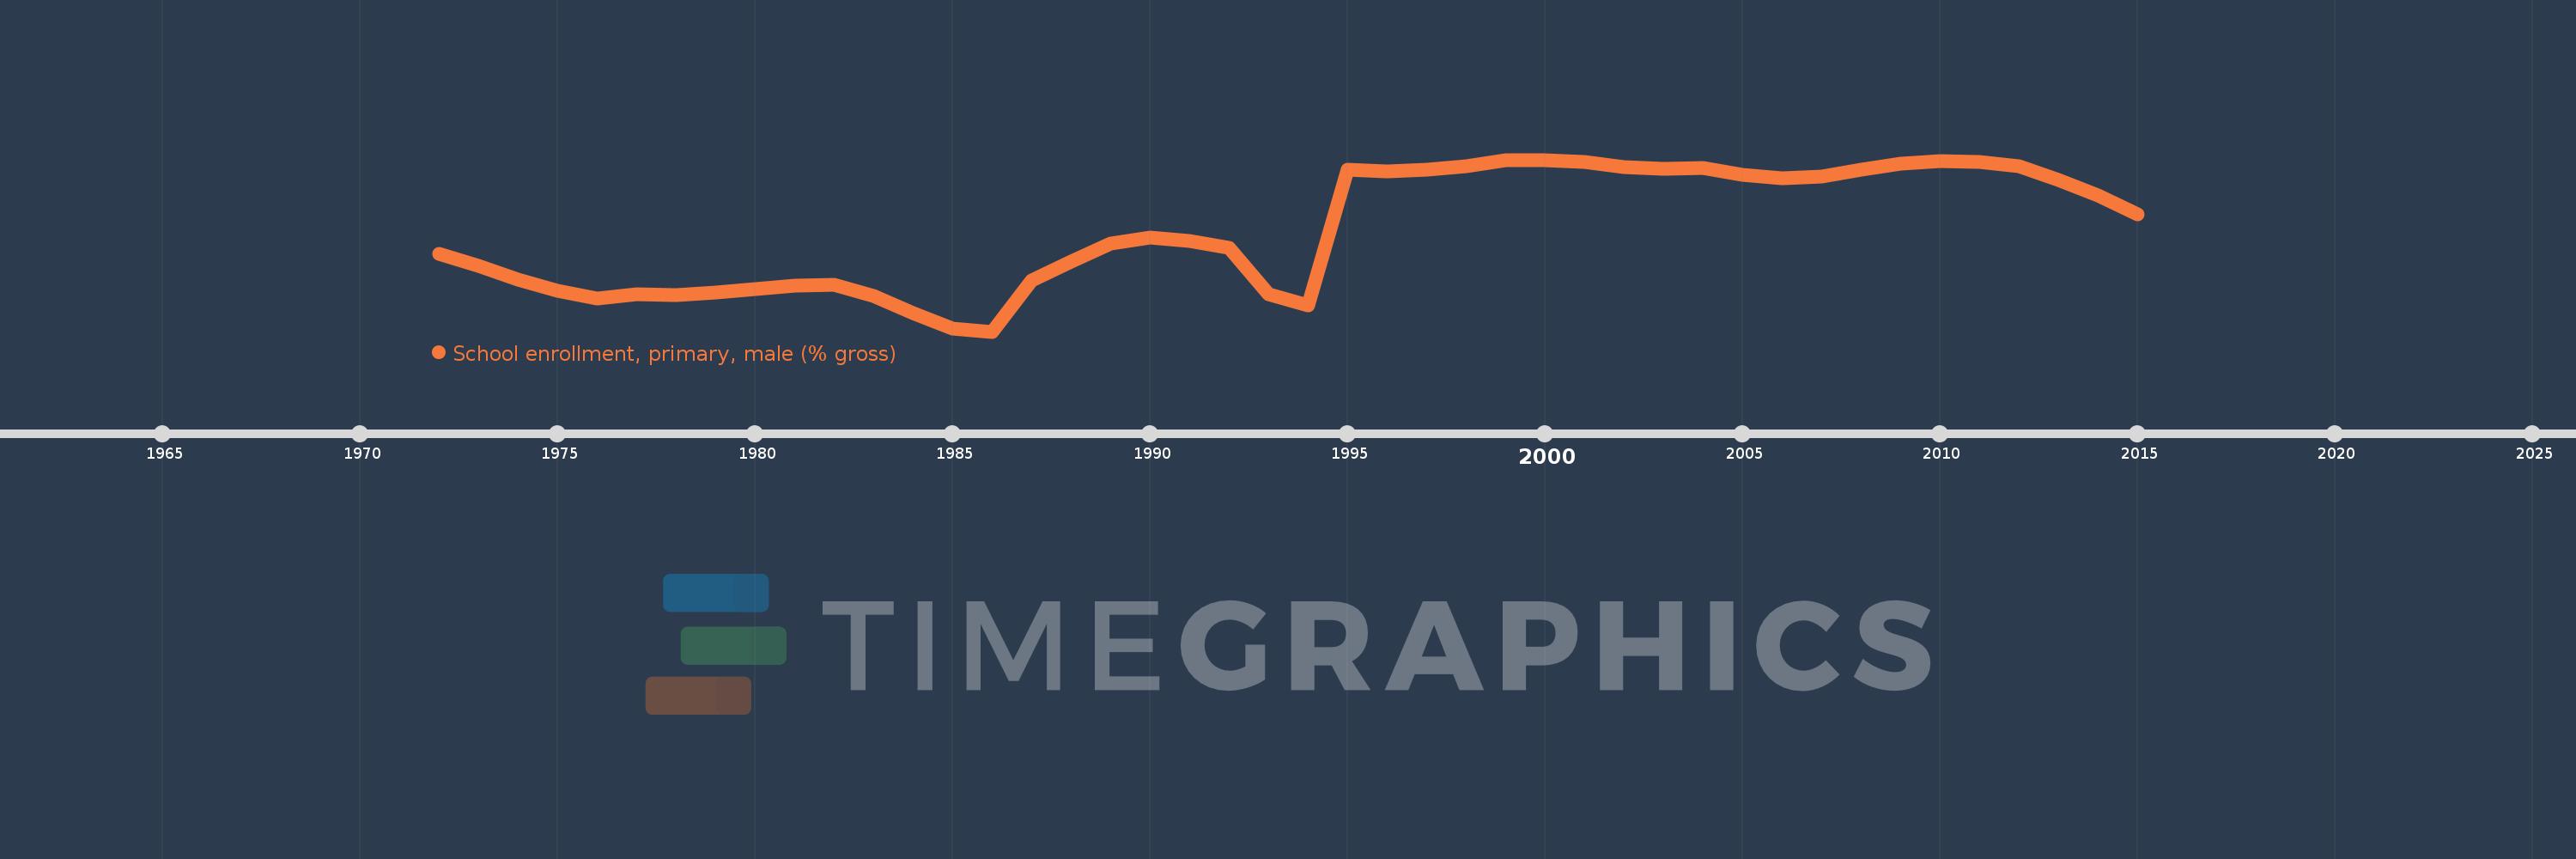
School enrollment, primary, male (% gross)
2015,2014,2013,2012,2011,2010,2009,2008,2007,2006,2005,2004,2003,2002,2001,2000,1999,1998,1997,1996,1995,1994,1993,1992,1991,1990,1989,1988,1987,1986,1985,1984,1983,1982,1981,1980,1979,1978,1977,1976,1975,1974,1973,1972
This statistics in other country:
AfghanistanAlbaniaAlgeriaAndorraAngolaAntigua and BarbudaArab WorldArgentinaArmeniaArubaAustraliaAustriaAzerbaijanBahamas, TheBahrainBangladeshBarbadosBelarusBelgiumBelizeBeninBermudaBhutanBoliviaBosnia and HerzegovinaBotswanaBrazilBrunei DarussalamBulgariaBurkina FasoBurundiCabo VerdeCambodiaCameroonCanadaCaribbean small statesCentral African RepublicCentral Europe and the BalticsChadChileChinaColombiaComorosCongo, Dem. Rep.Congo, Rep.Costa RicaCote d'IvoireCroatiaCubaCuracaoCyprusCzech RepublicDenmarkDjiboutiDominicaDominican RepublicEarly-demographic dividendEast Asia & PacificEast Asia & Pacific (excluding high income)East Asia & Pacific (IDA & IBRD countries)EcuadorEgypt, Arab Rep.El SalvadorEquatorial GuineaEritreaEstoniaEthiopiaEuro areaEurope & Central AsiaEurope & Central Asia (excluding high income)Europe & Central Asia (IDA & IBRD countries)European UnionFijiFinlandFragile and conflict affected situationsFranceGabonGambia, TheGeorgiaGermanyGhanaGreeceGrenadaGuatemalaGuineaGuinea-BissauGuyanaHaitiHeavily indebted poor countries (HIPC)High incomeHondurasHong Kong SAR, ChinaHungaryIBRD onlyIcelandIDA & IBRD totalIDA blendIDA onlyIDA totalIndiaIndonesiaIran, Islamic Rep.IraqIrelandIsraelItalyJamaicaJapanJordanKazakhstanKenyaKiribatiKorea, Dem. People’s Rep.Korea, Rep.KuwaitKyrgyz RepublicLao PDRLate-demographic dividendLatin America & Caribbean Latin America & Caribbean (excluding high income)Latin America & the Caribbean (IDA & IBRD countries)LatviaLeast developed countries: UN classificationLebanonLesothoLiberiaLibyaLiechtensteinLithuaniaLow & middle incomeLow incomeLower middle incomeLuxembourgMacao SAR, ChinaMacedonia, FYRMadagascarMalawiMaldivesMaliMaltaMarshall IslandsMauritaniaMauritiusMexicoMicronesia, Fed. Sts.Middle East & North AfricaMiddle East & North Africa (excluding high income)Middle East & North Africa (IDA & IBRD countries)Middle incomeMoldovaMongoliaMontenegroMoroccoMozambiqueMyanmarNamibiaNauruNepalNetherlandsNew ZealandNicaraguaNigerNigeriaNorth AmericaNorwayOECD membersOmanOther small statesPacific island small statesPakistanPalauPanamaPapua New GuineaParaguayPeruPhilippinesPolandPortugalPost-demographic dividendPre-demographic dividendPuerto RicoQatarRomaniaRussian FederationRwandaSamoaSan MarinoSao Tome and PrincipeSaudi ArabiaSenegalSerbiaSeychellesSierra LeoneSlovak RepublicSloveniaSmall statesSolomon IslandsSomaliaSouth AfricaSouth AsiaSouth Asia (IDA & IBRD)South SudanSpainSri LankaSt. Kitts and NevisSt. LuciaSt. Vincent and the GrenadinesSub-Saharan Africa Sub-Saharan Africa (excluding high income)Sub-Saharan Africa (IDA & IBRD countries)SudanSurinameSwazilandSwedenSwitzerlandSyrian Arab RepublicTajikistanTanzaniaThailandTimor-LesteTogoTongaTrinidad and TobagoTunisiaTurkeyTurkmenistanTuvaluUgandaUkraineUnited Arab EmiratesUnited KingdomUnited StatesUpper middle incomeUruguayUzbekistanVanuatuVenezuela, RBVietnamWest Bank and GazaWorldYemen, Rep.ZambiaZimbabwe Timeline:
This timeline shows a graph from 1972 to 2015 of Netherlands. No data until 1971. Number of actual observations by date: 44.
Source name:
World Development Indicators
Source organization:
United Nations Educational, Scientific, and Cultural Organization (UNESCO) Institute for Statistics.
Categories, topics:
Education, Gender
Last updated:
apr 23, 2017
Indicators value changes by year
Minimum:
93.805
jan 1, 1986
Maximum:
109.914
jan 1, 2000
At the date of observation
Value
Absolute change
Change from previous value
jan 1, 1972
101.101
+101.101
0.0%
jan 1, 1973
99.976
-1.125
-1.11%
jan 1, 1974
98.644
-1.332
-1.33%
jan 1, 1975
97.63
-1.014
-1.03%
jan 1, 1976
96.891
-0.738
-0.76%
jan 1, 1977
97.286
+0.395
0.41%
jan 1, 1978
97.267
-0.019
-0.02%
jan 1, 1979
97.436
+0.169
0.17%
jan 1, 1980
97.777
+0.341
0.35%
jan 1, 1981
98.146
+0.369
0.38%
jan 1, 1982
98.187
+0.041
0.04%
jan 1, 1983
97.117
-1.07
-1.09%
jan 1, 1984
95.509
-1.609
-1.66%
jan 1, 1985
94.111
-1.397
-1.46%
jan 1, 1986
93.805
-0.307
-0.33%
jan 1, 1987
98.62
+4.815
5.13%
jan 1, 1988
100.332
+1.712
1.74%
jan 1, 1989
102.022
+1.691
1.69%
jan 1, 1990
102.624
+0.601
0.59%
jan 1, 1991
102.274
-0.35
-0.34%
jan 1, 1992
101.663
-0.61
-0.6%
jan 1, 1993
97.277
-4.386
-4.31%
jan 1, 1994
96.252
-1.026
-1.05%
jan 1, 1995
108.976
+12.725
13.22%
jan 1, 1996
108.855
-0.121
-0.11%
jan 1, 1997
108.978
+0.123
0.11%
jan 1, 1998
109.333
+0.355
0.33%
jan 1, 1999
109.843
+0.511
0.47%
jan 1, 2000
109.914
+0.07
0.06%
jan 1, 2001
109.749
-0.165
-0.15%
jan 1, 2002
109.238
-0.511
-0.47%
jan 1, 2003
109.043
-0.194
-0.18%
jan 1, 2004
109.12
+0.077
0.07%
jan 1, 2005
108.519
-0.6
-0.55%
jan 1, 2006
108.172
-0.347
-0.32%
jan 1, 2007
108.379
+0.206
0.19%
jan 1, 2008
108.95
+0.572
0.53%
jan 1, 2009
109.55
+0.6
0.55%
jan 1, 2010
109.814
+0.264
0.24%
jan 1, 2011
109.751
-0.063
-0.06%
jan 1, 2012
109.337
-0.414
-0.38%
jan 1, 2013
108.014
-1.323
-1.21%
jan 1, 2014
106.567
-1.447
-1.34%
jan 1, 2015
104.766
-1.801
-1.69%
Ranking of countries by current statistics by years


Comments: