29
/
en
AIzaSyAYiBZKx7MnpbEhh9jyipgxe19OcubqV5w
April 1, 2024
204710
Myanmar
MMR
true
2
1
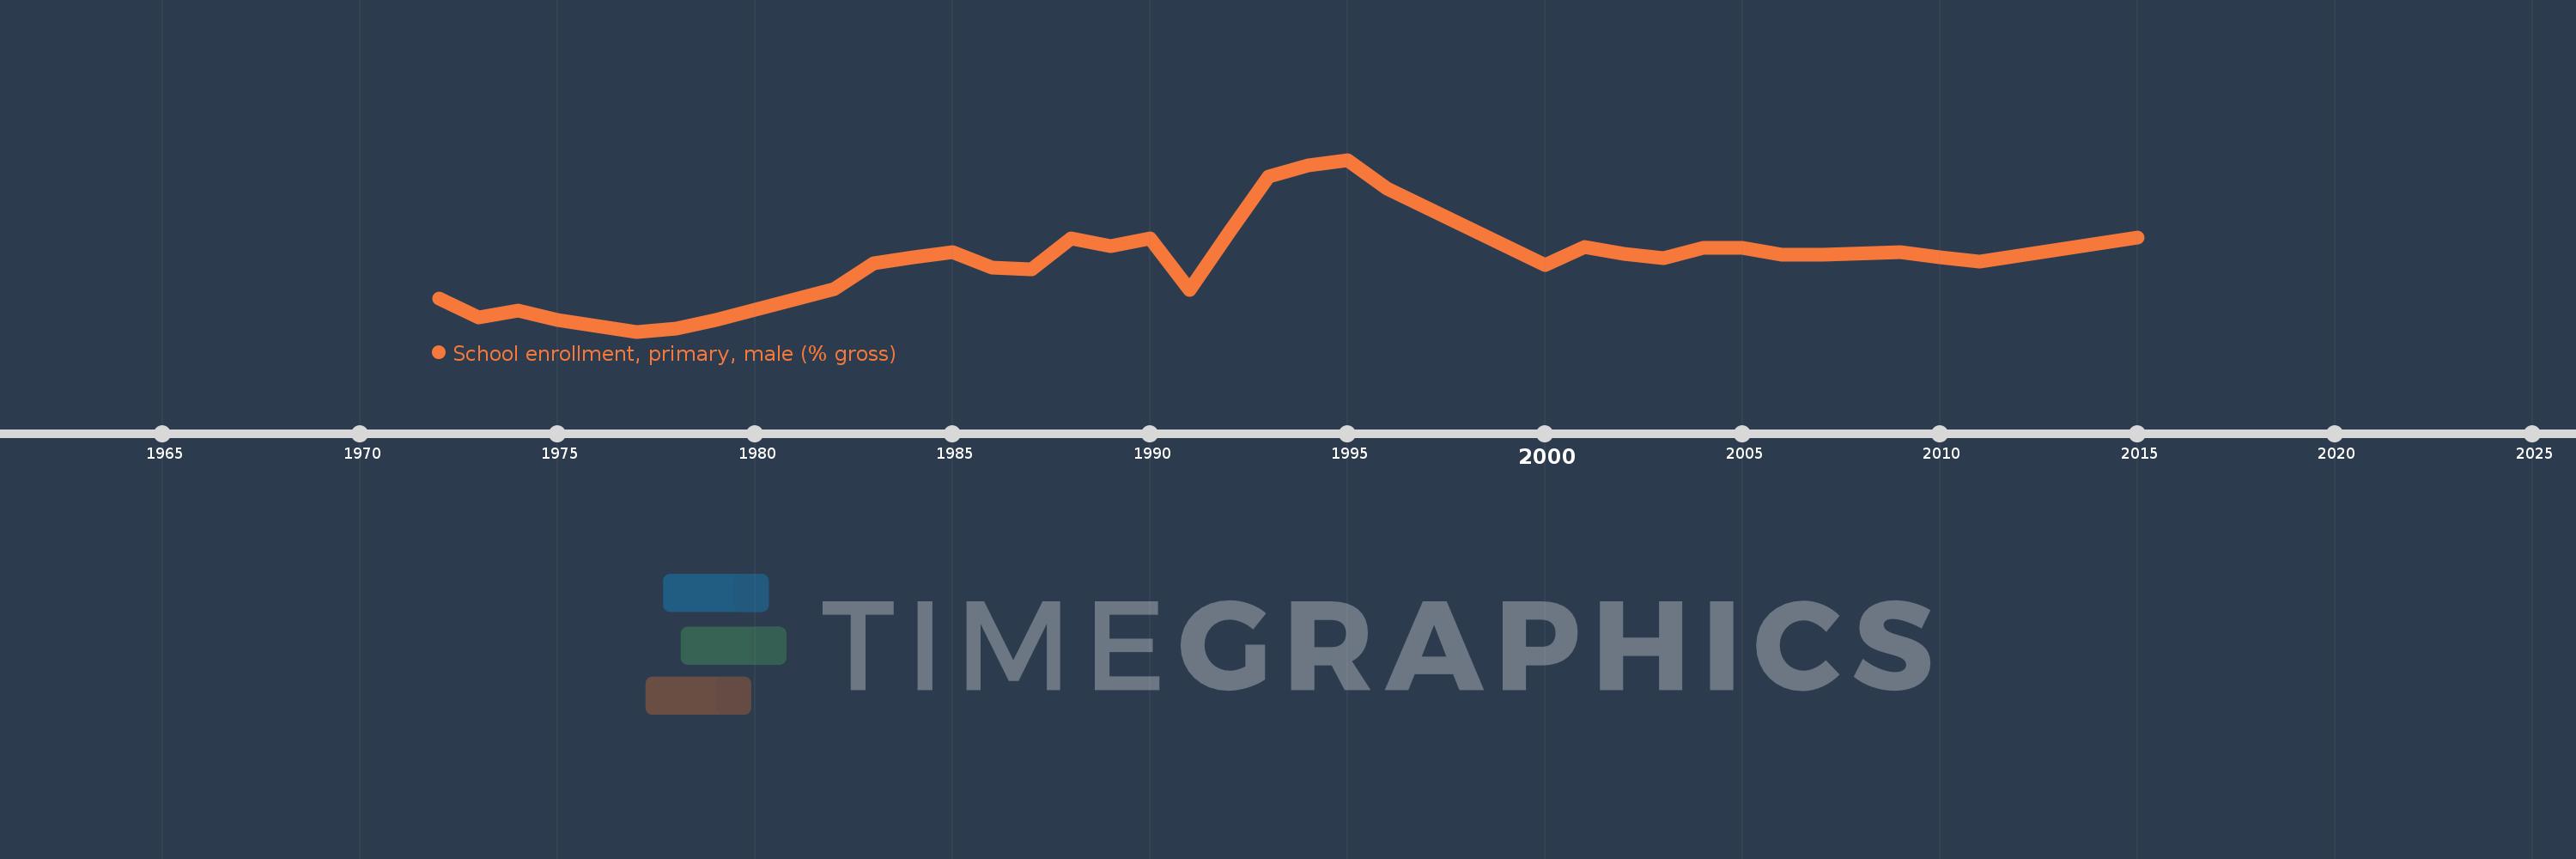
School enrollment, primary, male (% gross)
2015,2011,2010,2009,2007,2006,2005,2004,2003,2002,2001,2000,1996,1995,1994,1993,1992,1991,1990,1989,1988,1987,1986,1985,1984,1983,1982,1979,1978,1977,1975,1974,1973,1972
This statistics in other country:
AfghanistanAlbaniaAlgeriaAndorraAngolaAntigua and BarbudaArab WorldArgentinaArmeniaArubaAustraliaAustriaAzerbaijanBahamas, TheBahrainBangladeshBarbadosBelarusBelgiumBelizeBeninBermudaBhutanBoliviaBosnia and HerzegovinaBotswanaBrazilBrunei DarussalamBulgariaBurkina FasoBurundiCabo VerdeCambodiaCameroonCanadaCaribbean small statesCentral African RepublicCentral Europe and the BalticsChadChileChinaColombiaComorosCongo, Dem. Rep.Congo, Rep.Costa RicaCote d'IvoireCroatiaCubaCuracaoCyprusCzech RepublicDenmarkDjiboutiDominicaDominican RepublicEarly-demographic dividendEast Asia & PacificEast Asia & Pacific (excluding high income)East Asia & Pacific (IDA & IBRD countries)EcuadorEgypt, Arab Rep.El SalvadorEquatorial GuineaEritreaEstoniaEthiopiaEuro areaEurope & Central AsiaEurope & Central Asia (excluding high income)Europe & Central Asia (IDA & IBRD countries)European UnionFijiFinlandFragile and conflict affected situationsFranceGabonGambia, TheGeorgiaGermanyGhanaGreeceGrenadaGuatemalaGuineaGuinea-BissauGuyanaHaitiHeavily indebted poor countries (HIPC)High incomeHondurasHong Kong SAR, ChinaHungaryIBRD onlyIcelandIDA & IBRD totalIDA blendIDA onlyIDA totalIndiaIndonesiaIran, Islamic Rep.IraqIrelandIsraelItalyJamaicaJapanJordanKazakhstanKenyaKiribatiKorea, Dem. People’s Rep.Korea, Rep.KuwaitKyrgyz RepublicLao PDRLate-demographic dividendLatin America & Caribbean Latin America & Caribbean (excluding high income)Latin America & the Caribbean (IDA & IBRD countries)LatviaLeast developed countries: UN classificationLebanonLesothoLiberiaLibyaLiechtensteinLithuaniaLow & middle incomeLow incomeLower middle incomeLuxembourgMacao SAR, ChinaMacedonia, FYRMadagascarMalawiMaldivesMaliMaltaMarshall IslandsMauritaniaMauritiusMexicoMicronesia, Fed. Sts.Middle East & North AfricaMiddle East & North Africa (excluding high income)Middle East & North Africa (IDA & IBRD countries)Middle incomeMoldovaMongoliaMontenegroMoroccoMozambiqueMyanmarNamibiaNauruNepalNetherlandsNew ZealandNicaraguaNigerNigeriaNorth AmericaNorwayOECD membersOmanOther small statesPacific island small statesPakistanPalauPanamaPapua New GuineaParaguayPeruPhilippinesPolandPortugalPost-demographic dividendPre-demographic dividendPuerto RicoQatarRomaniaRussian FederationRwandaSamoaSan MarinoSao Tome and PrincipeSaudi ArabiaSenegalSerbiaSeychellesSierra LeoneSlovak RepublicSloveniaSmall statesSolomon IslandsSomaliaSouth AfricaSouth AsiaSouth Asia (IDA & IBRD)South SudanSpainSri LankaSt. Kitts and NevisSt. LuciaSt. Vincent and the GrenadinesSub-Saharan Africa Sub-Saharan Africa (excluding high income)Sub-Saharan Africa (IDA & IBRD countries)SudanSurinameSwazilandSwedenSwitzerlandSyrian Arab RepublicTajikistanTanzaniaThailandTimor-LesteTogoTongaTrinidad and TobagoTunisiaTurkeyTurkmenistanTuvaluUgandaUkraineUnited Arab EmiratesUnited KingdomUnited StatesUpper middle incomeUruguayUzbekistanVanuatuVenezuela, RBVietnamWest Bank and GazaWorldYemen, Rep.ZambiaZimbabwe Timeline:
This timeline shows a graph from 1972 to 2015 of Myanmar. No data until 1971. Number of actual observations by date: 34.
Source name:
World Development Indicators
Source organization:
United Nations Educational, Scientific, and Cultural Organization (UNESCO) Institute for Statistics.
Categories, topics:
Education, Gender
Last updated:
apr 23, 2017
Indicators value changes by year
Minimum:
86.132
jan 1, 1977
Maximum:
113.209
jan 1, 1995
At the date of observation
Value
Absolute change
Change from previous value
jan 1, 1972
91.408
+91.408
0.0%
jan 1, 1973
88.38
-3.028
-3.31%
jan 1, 1974
89.469
+1.089
1.23%
jan 1, 1975
87.969
-1.5
-1.68%
jan 1, 1977
86.132
-1.837
-2.09%
jan 1, 1978
86.624
+0.492
0.57%
jan 1, 1979
88.022
+1.397
1.61%
jan 1, 1982
92.82
+4.799
5.45%
jan 1, 1983
96.904
+4.084
4.4%
jan 1, 1984
97.835
+0.931
0.96%
jan 1, 1985
98.628
+0.793
0.81%
jan 1, 1986
96.156
-2.472
-2.51%
jan 1, 1987
96.014
-0.142
-0.15%
jan 1, 1988
100.821
+4.807
5.01%
jan 1, 1989
99.653
-1.167
-1.16%
jan 1, 1990
100.863
+1.21
1.21%
jan 1, 1991
92.676
-8.187
-8.12%
jan 1, 1992
101.715
+9.039
9.75%
jan 1, 1993
110.577
+8.862
8.71%
jan 1, 1994
112.353
+1.776
1.61%
jan 1, 1995
113.209
+0.856
0.76%
jan 1, 1996
108.609
-4.599
-4.06%
jan 1, 2000
96.567
-12.043
-11.09%
jan 1, 2001
99.444
+2.877
2.98%
jan 1, 2002
98.361
-1.082
-1.09%
jan 1, 2003
97.754
-0.607
-0.62%
jan 1, 2004
99.39
+1.636
1.67%
jan 1, 2005
99.272
-0.118
-0.12%
jan 1, 2006
98.193
-1.08
-1.09%
jan 1, 2007
98.281
+0.089
0.09%
jan 1, 2009
98.716
+0.435
0.44%
jan 1, 2010
97.803
-0.912
-0.92%
jan 1, 2011
97.123
-0.681
-0.7%
jan 1, 2015
101.005
+3.883
4.0%
Ranking of countries by current statistics by years


Comments: