29
/
en
AIzaSyAYiBZKx7MnpbEhh9jyipgxe19OcubqV5w
April 1, 2024
33841
European Union
EUU
false
2
1
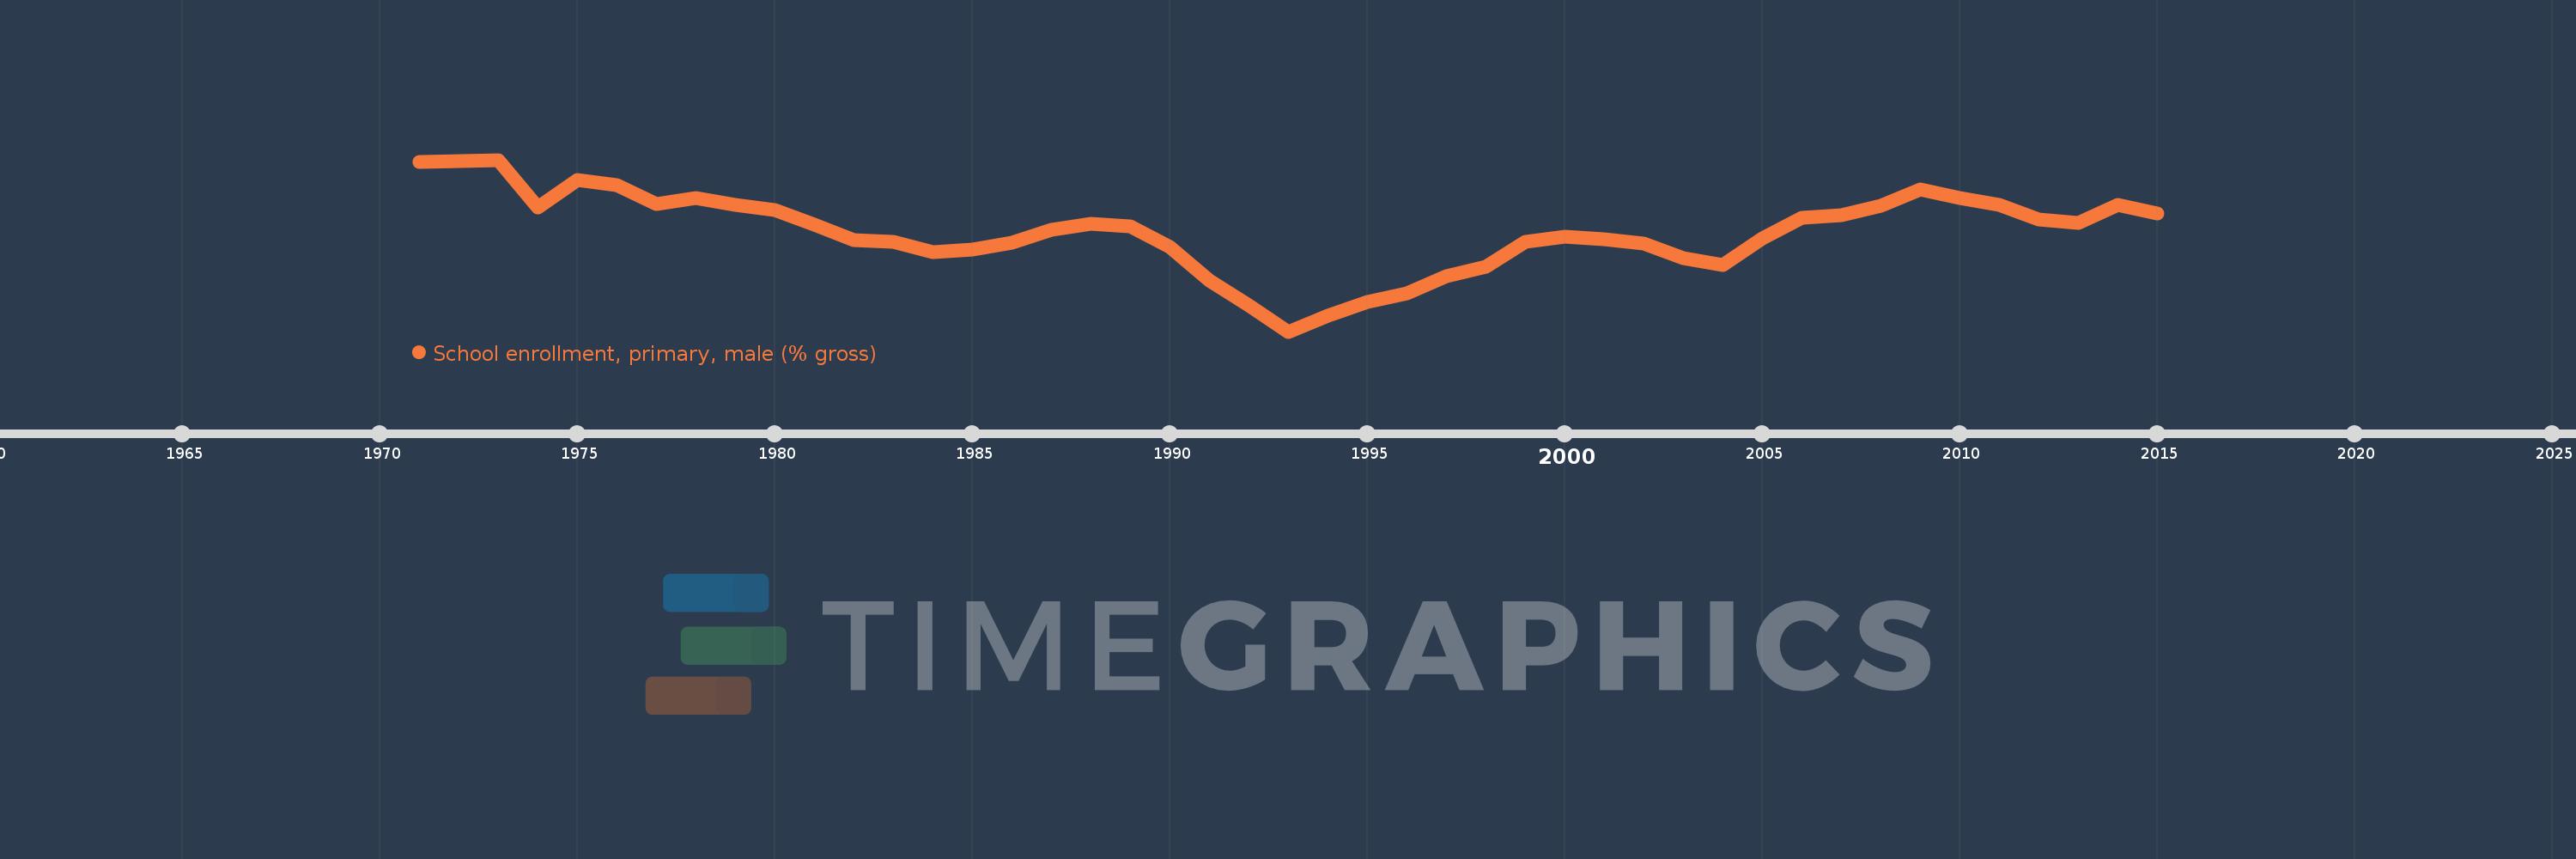
School enrollment, primary, male (% gross)
2015,2014,2013,2012,2011,2010,2009,2008,2007,2006,2005,2004,2003,2002,2001,2000,1999,1998,1997,1996,1995,1994,1993,1992,1991,1990,1989,1988,1987,1986,1985,1984,1983,1982,1981,1980,1979,1978,1977,1976,1975,1974,1973,1972,1971
This statistics in other country:
AfghanistanAlbaniaAlgeriaAndorraAngolaAntigua and BarbudaArab WorldArgentinaArmeniaArubaAustraliaAustriaAzerbaijanBahamas, TheBahrainBangladeshBarbadosBelarusBelgiumBelizeBeninBermudaBhutanBoliviaBosnia and HerzegovinaBotswanaBrazilBrunei DarussalamBulgariaBurkina FasoBurundiCabo VerdeCambodiaCameroonCanadaCaribbean small statesCentral African RepublicCentral Europe and the BalticsChadChileChinaColombiaComorosCongo, Dem. Rep.Congo, Rep.Costa RicaCote d'IvoireCroatiaCubaCuracaoCyprusCzech RepublicDenmarkDjiboutiDominicaDominican RepublicEarly-demographic dividendEast Asia & PacificEast Asia & Pacific (excluding high income)East Asia & Pacific (IDA & IBRD countries)EcuadorEgypt, Arab Rep.El SalvadorEquatorial GuineaEritreaEstoniaEthiopiaEuro areaEurope & Central AsiaEurope & Central Asia (excluding high income)Europe & Central Asia (IDA & IBRD countries)European UnionFijiFinlandFragile and conflict affected situationsFranceGabonGambia, TheGeorgiaGermanyGhanaGreeceGrenadaGuatemalaGuineaGuinea-BissauGuyanaHaitiHeavily indebted poor countries (HIPC)High incomeHondurasHong Kong SAR, ChinaHungaryIBRD onlyIcelandIDA & IBRD totalIDA blendIDA onlyIDA totalIndiaIndonesiaIran, Islamic Rep.IraqIrelandIsraelItalyJamaicaJapanJordanKazakhstanKenyaKiribatiKorea, Dem. People’s Rep.Korea, Rep.KuwaitKyrgyz RepublicLao PDRLate-demographic dividendLatin America & Caribbean Latin America & Caribbean (excluding high income)Latin America & the Caribbean (IDA & IBRD countries)LatviaLeast developed countries: UN classificationLebanonLesothoLiberiaLibyaLiechtensteinLithuaniaLow & middle incomeLow incomeLower middle incomeLuxembourgMacao SAR, ChinaMacedonia, FYRMadagascarMalawiMaldivesMaliMaltaMarshall IslandsMauritaniaMauritiusMexicoMicronesia, Fed. Sts.Middle East & North AfricaMiddle East & North Africa (excluding high income)Middle East & North Africa (IDA & IBRD countries)Middle incomeMoldovaMongoliaMontenegroMoroccoMozambiqueMyanmarNamibiaNauruNepalNetherlandsNew ZealandNicaraguaNigerNigeriaNorth AmericaNorwayOECD membersOmanOther small statesPacific island small statesPakistanPalauPanamaPapua New GuineaParaguayPeruPhilippinesPolandPortugalPost-demographic dividendPre-demographic dividendPuerto RicoQatarRomaniaRussian FederationRwandaSamoaSan MarinoSao Tome and PrincipeSaudi ArabiaSenegalSerbiaSeychellesSierra LeoneSlovak RepublicSloveniaSmall statesSolomon IslandsSomaliaSouth AfricaSouth AsiaSouth Asia (IDA & IBRD)South SudanSpainSri LankaSt. Kitts and NevisSt. LuciaSt. Vincent and the GrenadinesSub-Saharan Africa Sub-Saharan Africa (excluding high income)Sub-Saharan Africa (IDA & IBRD countries)SudanSurinameSwazilandSwedenSwitzerlandSyrian Arab RepublicTajikistanTanzaniaThailandTimor-LesteTogoTongaTrinidad and TobagoTunisiaTurkeyTurkmenistanTuvaluUgandaUkraineUnited Arab EmiratesUnited KingdomUnited StatesUpper middle incomeUruguayUzbekistanVanuatuVenezuela, RBVietnamWest Bank and GazaWorldYemen, Rep.ZambiaZimbabwe Timeline:
This timeline shows a graph from 1971 to 2015 of European Union. No data until 1970. Number of actual observations by date: 45.
Source name:
World Development Indicators
Source organization:
United Nations Educational, Scientific, and Cultural Organization (UNESCO) Institute for Statistics.
Categories, topics:
Education, Gender
Last updated:
apr 23, 2017
Indicators value changes by year
Minimum:
100.787
jan 1, 1993
Maximum:
105.814
jan 1, 1973
At the date of observation
Value
Absolute change
Change from previous value
jan 1, 1971
105.755
+105.755
0.0%
jan 1, 1972
105.782
+0.027
0.03%
jan 1, 1973
105.814
+0.032
0.03%
jan 1, 1974
104.408
-1.406
-1.33%
jan 1, 1975
105.232
+0.824
0.79%
jan 1, 1976
105.068
-0.164
-0.16%
jan 1, 1977
104.513
-0.555
-0.53%
jan 1, 1978
104.708
+0.195
0.19%
jan 1, 1979
104.502
-0.206
-0.2%
jan 1, 1980
104.34
-0.162
-0.16%
jan 1, 1981
103.916
-0.424
-0.41%
jan 1, 1982
103.458
-0.458
-0.44%
jan 1, 1983
103.41
-0.048
-0.05%
jan 1, 1984
103.102
-0.307
-0.3%
jan 1, 1985
103.193
+0.091
0.09%
jan 1, 1986
103.4
+0.207
0.2%
jan 1, 1987
103.757
+0.357
0.34%
jan 1, 1988
103.929
+0.172
0.17%
jan 1, 1989
103.876
-0.053
-0.05%
jan 1, 1990
103.252
-0.624
-0.6%
jan 1, 1991
102.289
-0.963
-0.93%
jan 1, 1992
101.563
-0.726
-0.71%
jan 1, 1993
100.787
-0.776
-0.76%
jan 1, 1994
101.26
+0.473
0.47%
jan 1, 1995
101.665
+0.404
0.4%
jan 1, 1996
101.905
+0.241
0.24%
jan 1, 1997
102.407
+0.502
0.49%
jan 1, 1998
102.693
+0.285
0.28%
jan 1, 1999
103.411
+0.719
0.7%
jan 1, 2000
103.566
+0.155
0.15%
jan 1, 2001
103.501
-0.064
-0.06%
jan 1, 2002
103.351
-0.151
-0.15%
jan 1, 2003
102.924
-0.427
-0.41%
jan 1, 2004
102.742
-0.182
-0.18%
jan 1, 2005
103.51
+0.768
0.75%
jan 1, 2006
104.111
+0.6
0.58%
jan 1, 2007
104.186
+0.076
0.07%
jan 1, 2008
104.469
+0.283
0.27%
jan 1, 2009
104.951
+0.481
0.46%
jan 1, 2010
104.686
-0.264
-0.25%
jan 1, 2011
104.505
-0.182
-0.17%
jan 1, 2012
104.078
-0.426
-0.41%
jan 1, 2013
103.973
-0.105
-0.1%
jan 1, 2014
104.487
+0.514
0.49%
jan 1, 2015
104.253
-0.234
-0.22%
Ranking of countries by current statistics by years


Comments: