29
/
en
AIzaSyAYiBZKx7MnpbEhh9jyipgxe19OcubqV5w
April 1, 2024
157931
Iran, Islamic Rep.
IRN
true
2
1
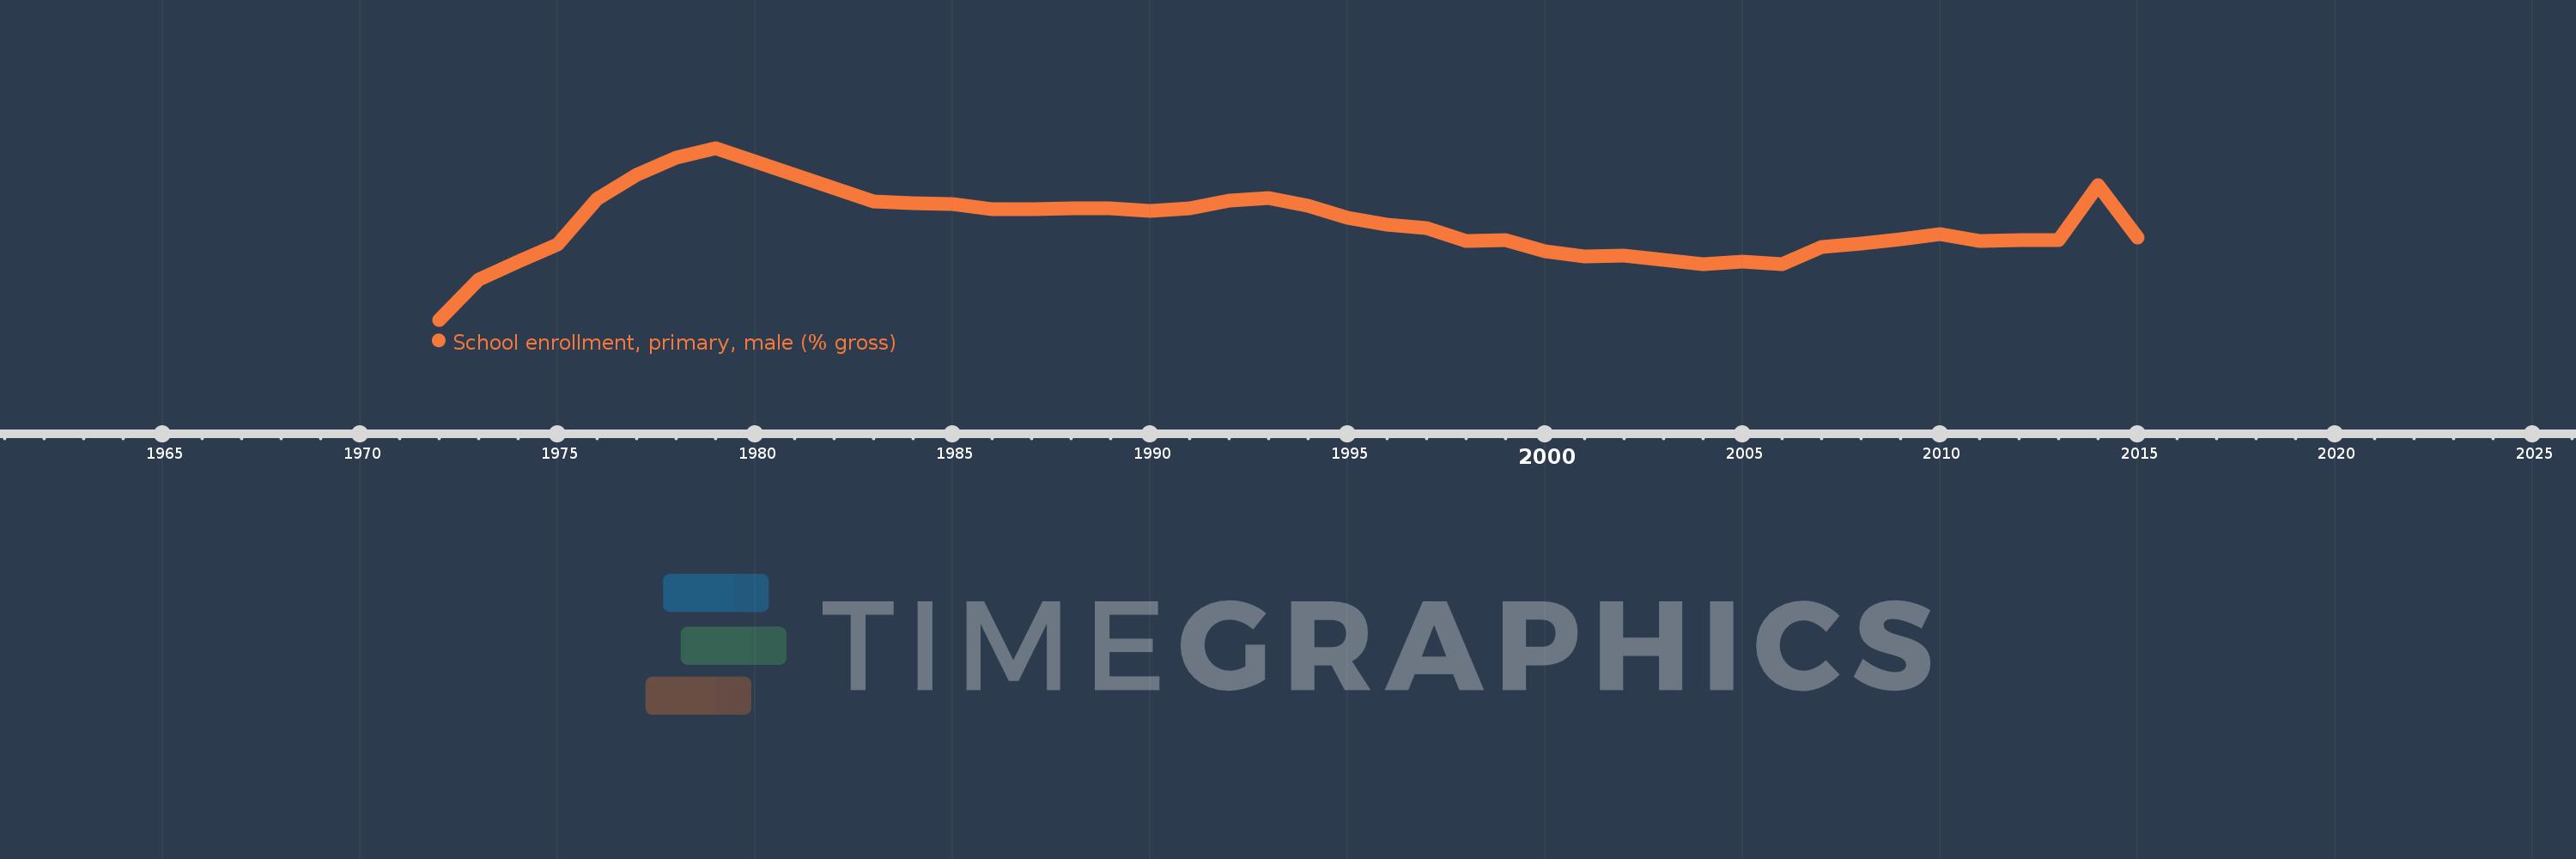
School enrollment, primary, male (% gross)
2015,2014,2013,2012,2011,2010,2009,2008,2007,2006,2005,2004,2003,2002,2001,2000,1999,1998,1997,1996,1995,1994,1993,1992,1991,1990,1989,1988,1987,1986,1985,1984,1983,1979,1978,1977,1976,1975,1974,1973,1972
This statistics in other country:
AfghanistanAlbaniaAlgeriaAndorraAngolaAntigua and BarbudaArab WorldArgentinaArmeniaArubaAustraliaAustriaAzerbaijanBahamas, TheBahrainBangladeshBarbadosBelarusBelgiumBelizeBeninBermudaBhutanBoliviaBosnia and HerzegovinaBotswanaBrazilBrunei DarussalamBulgariaBurkina FasoBurundiCabo VerdeCambodiaCameroonCanadaCaribbean small statesCentral African RepublicCentral Europe and the BalticsChadChileChinaColombiaComorosCongo, Dem. Rep.Congo, Rep.Costa RicaCote d'IvoireCroatiaCubaCuracaoCyprusCzech RepublicDenmarkDjiboutiDominicaDominican RepublicEarly-demographic dividendEast Asia & PacificEast Asia & Pacific (excluding high income)East Asia & Pacific (IDA & IBRD countries)EcuadorEgypt, Arab Rep.El SalvadorEquatorial GuineaEritreaEstoniaEthiopiaEuro areaEurope & Central AsiaEurope & Central Asia (excluding high income)Europe & Central Asia (IDA & IBRD countries)European UnionFijiFinlandFragile and conflict affected situationsFranceGabonGambia, TheGeorgiaGermanyGhanaGreeceGrenadaGuatemalaGuineaGuinea-BissauGuyanaHaitiHeavily indebted poor countries (HIPC)High incomeHondurasHong Kong SAR, ChinaHungaryIBRD onlyIcelandIDA & IBRD totalIDA blendIDA onlyIDA totalIndiaIndonesiaIran, Islamic Rep.IraqIrelandIsraelItalyJamaicaJapanJordanKazakhstanKenyaKiribatiKorea, Dem. People’s Rep.Korea, Rep.KuwaitKyrgyz RepublicLao PDRLate-demographic dividendLatin America & Caribbean Latin America & Caribbean (excluding high income)Latin America & the Caribbean (IDA & IBRD countries)LatviaLeast developed countries: UN classificationLebanonLesothoLiberiaLibyaLiechtensteinLithuaniaLow & middle incomeLow incomeLower middle incomeLuxembourgMacao SAR, ChinaMacedonia, FYRMadagascarMalawiMaldivesMaliMaltaMarshall IslandsMauritaniaMauritiusMexicoMicronesia, Fed. Sts.Middle East & North AfricaMiddle East & North Africa (excluding high income)Middle East & North Africa (IDA & IBRD countries)Middle incomeMoldovaMongoliaMontenegroMoroccoMozambiqueMyanmarNamibiaNauruNepalNetherlandsNew ZealandNicaraguaNigerNigeriaNorth AmericaNorwayOECD membersOmanOther small statesPacific island small statesPakistanPalauPanamaPapua New GuineaParaguayPeruPhilippinesPolandPortugalPost-demographic dividendPre-demographic dividendPuerto RicoQatarRomaniaRussian FederationRwandaSamoaSan MarinoSao Tome and PrincipeSaudi ArabiaSenegalSerbiaSeychellesSierra LeoneSlovak RepublicSloveniaSmall statesSolomon IslandsSomaliaSouth AfricaSouth AsiaSouth Asia (IDA & IBRD)South SudanSpainSri LankaSt. Kitts and NevisSt. LuciaSt. Vincent and the GrenadinesSub-Saharan Africa Sub-Saharan Africa (excluding high income)Sub-Saharan Africa (IDA & IBRD countries)SudanSurinameSwazilandSwedenSwitzerlandSyrian Arab RepublicTajikistanTanzaniaThailandTimor-LesteTogoTongaTrinidad and TobagoTunisiaTurkeyTurkmenistanTuvaluUgandaUkraineUnited Arab EmiratesUnited KingdomUnited StatesUpper middle incomeUruguayUzbekistanVanuatuVenezuela, RBVietnamWest Bank and GazaWorldYemen, Rep.ZambiaZimbabwe Timeline:
This timeline shows a graph from 1972 to 2015 of Iran, Islamic Rep.. No data until 1971. Number of actual observations by date: 41.
Source name:
World Development Indicators
Source organization:
United Nations Educational, Scientific, and Cultural Organization (UNESCO) Institute for Statistics.
Categories, topics:
Education, Gender
Last updated:
apr 23, 2017
Indicators value changes by year
Minimum:
89.933
jan 1, 1972
Maximum:
125.298
jan 1, 1979
At the date of observation
Value
Absolute change
Change from previous value
jan 1, 1972
89.933
+89.933
0.0%
jan 1, 1973
98.121
+8.188
9.1%
jan 1, 1974
101.91
+3.789
3.86%
jan 1, 1975
105.505
+3.594
3.53%
jan 1, 1976
114.74
+9.236
8.75%
jan 1, 1977
119.701
+4.961
4.32%
jan 1, 1978
123.244
+3.543
2.96%
jan 1, 1979
125.298
+2.054
1.67%
jan 1, 1983
114.209
-11.089
-8.85%
jan 1, 1984
113.931
-0.278
-0.24%
jan 1, 1985
113.757
-0.174
-0.15%
jan 1, 1986
112.621
-1.137
-1.0%
jan 1, 1987
112.769
+0.148
0.13%
jan 1, 1988
112.878
+0.11
0.1%
jan 1, 1989
112.907
+0.029
0.03%
jan 1, 1990
112.353
-0.554
-0.49%
jan 1, 1991
112.849
+0.496
0.44%
jan 1, 1992
114.371
+1.522
1.35%
jan 1, 1993
114.904
+0.532
0.47%
jan 1, 1994
113.43
-1.473
-1.28%
jan 1, 1995
110.903
-2.528
-2.23%
jan 1, 1996
109.554
-1.349
-1.22%
jan 1, 1997
108.874
-0.68
-0.62%
jan 1, 1998
106.112
-2.762
-2.54%
jan 1, 1999
106.238
+0.126
0.12%
jan 1, 2000
104.036
-2.202
-2.07%
jan 1, 2001
102.954
-1.082
-1.04%
jan 1, 2002
103.114
+0.16
0.16%
jan 1, 2003
102.277
-0.837
-0.81%
jan 1, 2004
101.328
-0.949
-0.93%
jan 1, 2005
101.955
+0.627
0.62%
jan 1, 2006
101.307
-0.649
-0.64%
jan 1, 2007
104.979
+3.672
3.62%
jan 1, 2008
105.578
+0.599
0.57%
jan 1, 2009
106.474
+0.896
0.85%
jan 1, 2010
107.486
+1.012
0.95%
jan 1, 2011
106.234
-1.252
-1.16%
jan 1, 2012
106.349
+0.115
0.11%
jan 1, 2013
106.382
+0.033
0.03%
jan 1, 2014
117.588
+11.206
10.53%
jan 1, 2015
106.866
-10.722
-9.12%
Ranking of countries by current statistics by years


Comments: