29
/
en
AIzaSyAYiBZKx7MnpbEhh9jyipgxe19OcubqV5w
April 1, 2024
105433
Chile
CHL
true
2
1
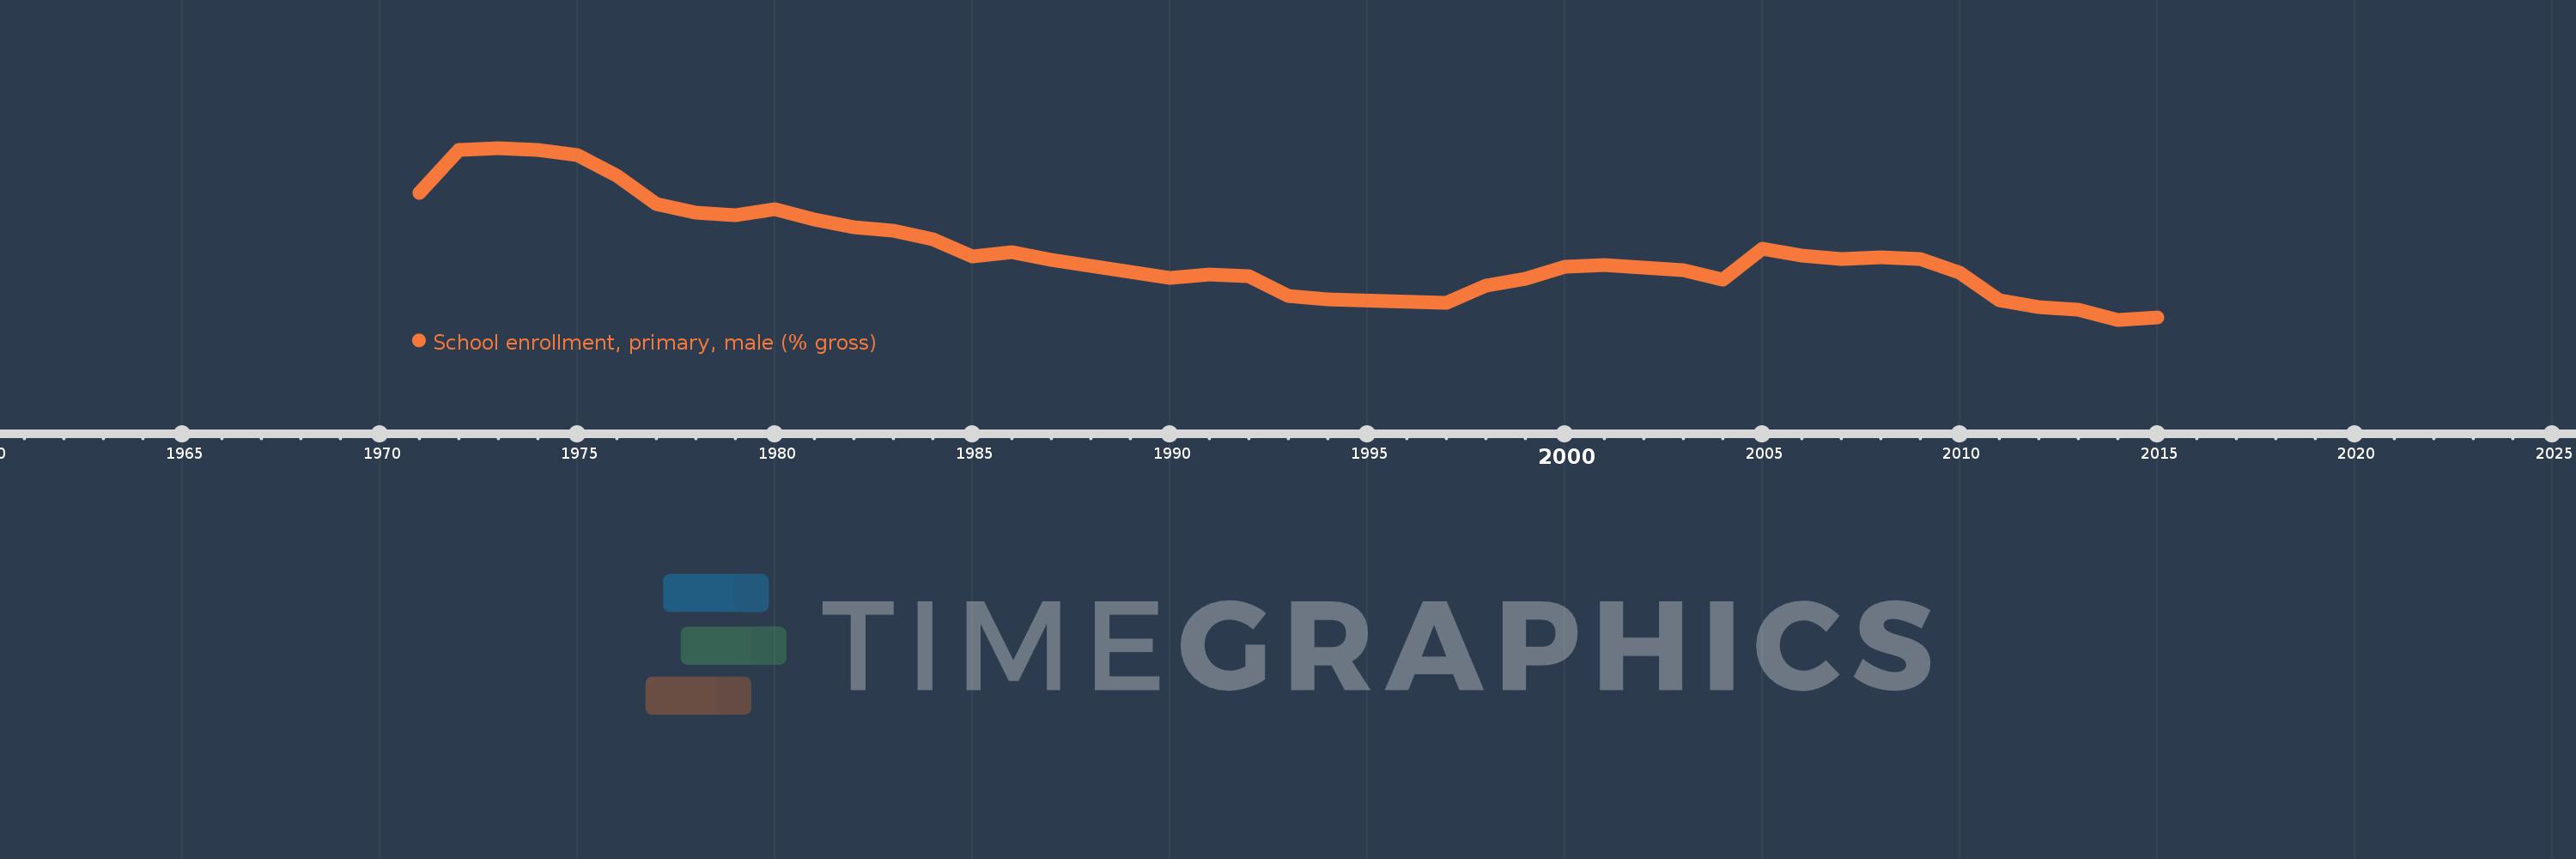
School enrollment, primary, male (% gross)
2015,2014,2013,2012,2011,2010,2009,2008,2007,2006,2005,2004,2003,2001,2000,1999,1998,1997,1994,1993,1992,1991,1990,1987,1986,1985,1984,1983,1982,1981,1980,1979,1978,1977,1976,1975,1974,1973,1972,1971
This statistics in other country:
AfghanistanAlbaniaAlgeriaAndorraAngolaAntigua and BarbudaArab WorldArgentinaArmeniaArubaAustraliaAustriaAzerbaijanBahamas, TheBahrainBangladeshBarbadosBelarusBelgiumBelizeBeninBermudaBhutanBoliviaBosnia and HerzegovinaBotswanaBrazilBrunei DarussalamBulgariaBurkina FasoBurundiCabo VerdeCambodiaCameroonCanadaCaribbean small statesCentral African RepublicCentral Europe and the BalticsChadChileChinaColombiaComorosCongo, Dem. Rep.Congo, Rep.Costa RicaCote d'IvoireCroatiaCubaCuracaoCyprusCzech RepublicDenmarkDjiboutiDominicaDominican RepublicEarly-demographic dividendEast Asia & PacificEast Asia & Pacific (excluding high income)East Asia & Pacific (IDA & IBRD countries)EcuadorEgypt, Arab Rep.El SalvadorEquatorial GuineaEritreaEstoniaEthiopiaEuro areaEurope & Central AsiaEurope & Central Asia (excluding high income)Europe & Central Asia (IDA & IBRD countries)European UnionFijiFinlandFragile and conflict affected situationsFranceGabonGambia, TheGeorgiaGermanyGhanaGreeceGrenadaGuatemalaGuineaGuinea-BissauGuyanaHaitiHeavily indebted poor countries (HIPC)High incomeHondurasHong Kong SAR, ChinaHungaryIBRD onlyIcelandIDA & IBRD totalIDA blendIDA onlyIDA totalIndiaIndonesiaIran, Islamic Rep.IraqIrelandIsraelItalyJamaicaJapanJordanKazakhstanKenyaKiribatiKorea, Dem. People’s Rep.Korea, Rep.KuwaitKyrgyz RepublicLao PDRLate-demographic dividendLatin America & Caribbean Latin America & Caribbean (excluding high income)Latin America & the Caribbean (IDA & IBRD countries)LatviaLeast developed countries: UN classificationLebanonLesothoLiberiaLibyaLiechtensteinLithuaniaLow & middle incomeLow incomeLower middle incomeLuxembourgMacao SAR, ChinaMacedonia, FYRMadagascarMalawiMaldivesMaliMaltaMarshall IslandsMauritaniaMauritiusMexicoMicronesia, Fed. Sts.Middle East & North AfricaMiddle East & North Africa (excluding high income)Middle East & North Africa (IDA & IBRD countries)Middle incomeMoldovaMongoliaMontenegroMoroccoMozambiqueMyanmarNamibiaNauruNepalNetherlandsNew ZealandNicaraguaNigerNigeriaNorth AmericaNorwayOECD membersOmanOther small statesPacific island small statesPakistanPalauPanamaPapua New GuineaParaguayPeruPhilippinesPolandPortugalPost-demographic dividendPre-demographic dividendPuerto RicoQatarRomaniaRussian FederationRwandaSamoaSan MarinoSao Tome and PrincipeSaudi ArabiaSenegalSerbiaSeychellesSierra LeoneSlovak RepublicSloveniaSmall statesSolomon IslandsSomaliaSouth AfricaSouth AsiaSouth Asia (IDA & IBRD)South SudanSpainSri LankaSt. Kitts and NevisSt. LuciaSt. Vincent and the GrenadinesSub-Saharan Africa Sub-Saharan Africa (excluding high income)Sub-Saharan Africa (IDA & IBRD countries)SudanSurinameSwazilandSwedenSwitzerlandSyrian Arab RepublicTajikistanTanzaniaThailandTimor-LesteTogoTongaTrinidad and TobagoTunisiaTurkeyTurkmenistanTuvaluUgandaUkraineUnited Arab EmiratesUnited KingdomUnited StatesUpper middle incomeUruguayUzbekistanVanuatuVenezuela, RBVietnamWest Bank and GazaWorldYemen, Rep.ZambiaZimbabwe Timeline:
This timeline shows a graph from 1971 to 2015 of Chile. No data until 1970. Number of actual observations by date: 40.
Source name:
World Development Indicators
Source organization:
United Nations Educational, Scientific, and Cultural Organization (UNESCO) Institute for Statistics.
Categories, topics:
Education, Gender
Last updated:
apr 23, 2017
Indicators value changes by year
Minimum:
101.834
jan 1, 2014
Maximum:
129.862
jan 1, 1973
At the date of observation
Value
Absolute change
Change from previous value
jan 1, 1971
122.478
+122.478
0.0%
jan 1, 1972
129.562
+7.084
5.78%
jan 1, 1973
129.862
+0.3
0.23%
jan 1, 1974
129.52
-0.342
-0.26%
jan 1, 1975
128.713
-0.807
-0.62%
jan 1, 1976
125.276
-3.436
-2.67%
jan 1, 1977
120.674
-4.603
-3.67%
jan 1, 1978
119.325
-1.349
-1.12%
jan 1, 1979
118.934
-0.391
-0.33%
jan 1, 1980
119.903
+0.969
0.81%
jan 1, 1981
118.246
-1.657
-1.38%
jan 1, 1982
116.987
-1.259
-1.06%
jan 1, 1983
116.341
-0.646
-0.55%
jan 1, 1984
114.984
-1.357
-1.17%
jan 1, 1985
112.145
-2.839
-2.47%
jan 1, 1986
112.841
+0.696
0.62%
jan 1, 1987
111.67
-1.171
-1.04%
jan 1, 1990
108.642
-3.028
-2.71%
jan 1, 1991
109.262
+0.62
0.57%
jan 1, 1992
108.944
-0.318
-0.29%
jan 1, 1993
105.703
-3.241
-2.97%
jan 1, 1994
105.181
-0.521
-0.49%
jan 1, 1997
104.578
-0.603
-0.57%
jan 1, 1998
107.409
+2.83
2.71%
jan 1, 1999
108.508
+1.099
1.02%
jan 1, 2000
110.482
+1.974
1.82%
jan 1, 2001
110.813
+0.331
0.3%
jan 1, 2003
109.851
-0.962
-0.87%
jan 1, 2004
108.413
-1.438
-1.31%
jan 1, 2005
113.42
+5.008
4.62%
jan 1, 2006
112.294
-1.126
-0.99%
jan 1, 2007
111.705
-0.589
-0.52%
jan 1, 2008
112.045
+0.34
0.3%
jan 1, 2009
111.789
-0.256
-0.23%
jan 1, 2010
109.548
-2.241
-2.0%
jan 1, 2011
104.946
-4.602
-4.2%
jan 1, 2012
103.945
-1.001
-0.95%
jan 1, 2013
103.43
-0.515
-0.5%
jan 1, 2014
101.834
-1.596
-1.54%
jan 1, 2015
102.145
+0.31
0.3%
Ranking of countries by current statistics by years


Comments: