29
/
en
AIzaSyAYiBZKx7MnpbEhh9jyipgxe19OcubqV5w
April 1, 2024
178271
Lesotho
LSO
true
2
1
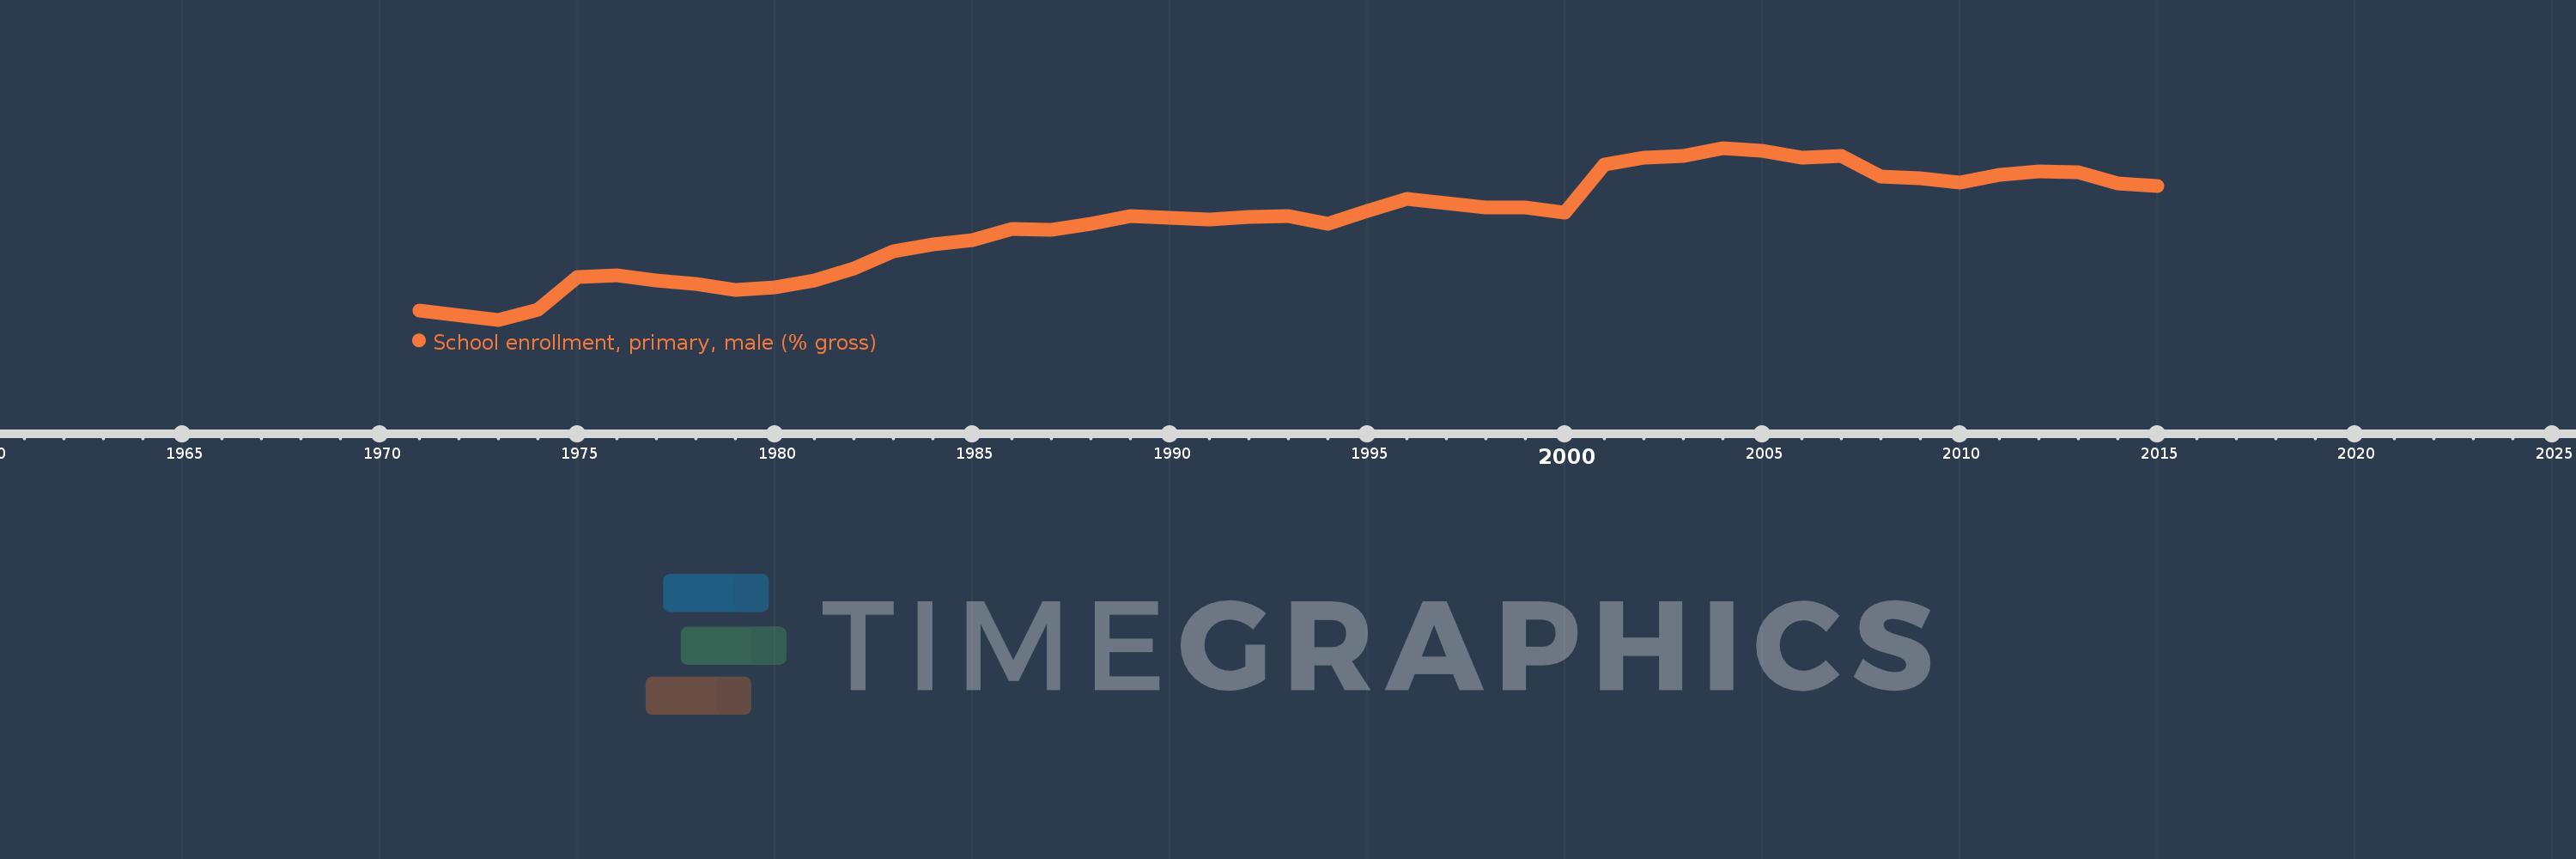
School enrollment, primary, male (% gross)
2015,2014,2013,2012,2011,2010,2009,2008,2007,2006,2005,2004,2003,2002,2001,2000,1999,1998,1997,1996,1995,1994,1993,1992,1991,1990,1989,1988,1987,1986,1985,1984,1983,1982,1981,1980,1979,1978,1977,1976,1975,1974,1973,1971
This statistics in other country:
AfghanistanAlbaniaAlgeriaAndorraAngolaAntigua and BarbudaArab WorldArgentinaArmeniaArubaAustraliaAustriaAzerbaijanBahamas, TheBahrainBangladeshBarbadosBelarusBelgiumBelizeBeninBermudaBhutanBoliviaBosnia and HerzegovinaBotswanaBrazilBrunei DarussalamBulgariaBurkina FasoBurundiCabo VerdeCambodiaCameroonCanadaCaribbean small statesCentral African RepublicCentral Europe and the BalticsChadChileChinaColombiaComorosCongo, Dem. Rep.Congo, Rep.Costa RicaCote d'IvoireCroatiaCubaCuracaoCyprusCzech RepublicDenmarkDjiboutiDominicaDominican RepublicEarly-demographic dividendEast Asia & PacificEast Asia & Pacific (excluding high income)East Asia & Pacific (IDA & IBRD countries)EcuadorEgypt, Arab Rep.El SalvadorEquatorial GuineaEritreaEstoniaEthiopiaEuro areaEurope & Central AsiaEurope & Central Asia (excluding high income)Europe & Central Asia (IDA & IBRD countries)European UnionFijiFinlandFragile and conflict affected situationsFranceGabonGambia, TheGeorgiaGermanyGhanaGreeceGrenadaGuatemalaGuineaGuinea-BissauGuyanaHaitiHeavily indebted poor countries (HIPC)High incomeHondurasHong Kong SAR, ChinaHungaryIBRD onlyIcelandIDA & IBRD totalIDA blendIDA onlyIDA totalIndiaIndonesiaIran, Islamic Rep.IraqIrelandIsraelItalyJamaicaJapanJordanKazakhstanKenyaKiribatiKorea, Dem. People’s Rep.Korea, Rep.KuwaitKyrgyz RepublicLao PDRLate-demographic dividendLatin America & Caribbean Latin America & Caribbean (excluding high income)Latin America & the Caribbean (IDA & IBRD countries)LatviaLeast developed countries: UN classificationLebanonLesothoLiberiaLibyaLiechtensteinLithuaniaLow & middle incomeLow incomeLower middle incomeLuxembourgMacao SAR, ChinaMacedonia, FYRMadagascarMalawiMaldivesMaliMaltaMarshall IslandsMauritaniaMauritiusMexicoMicronesia, Fed. Sts.Middle East & North AfricaMiddle East & North Africa (excluding high income)Middle East & North Africa (IDA & IBRD countries)Middle incomeMoldovaMongoliaMontenegroMoroccoMozambiqueMyanmarNamibiaNauruNepalNetherlandsNew ZealandNicaraguaNigerNigeriaNorth AmericaNorwayOECD membersOmanOther small statesPacific island small statesPakistanPalauPanamaPapua New GuineaParaguayPeruPhilippinesPolandPortugalPost-demographic dividendPre-demographic dividendPuerto RicoQatarRomaniaRussian FederationRwandaSamoaSan MarinoSao Tome and PrincipeSaudi ArabiaSenegalSerbiaSeychellesSierra LeoneSlovak RepublicSloveniaSmall statesSolomon IslandsSomaliaSouth AfricaSouth AsiaSouth Asia (IDA & IBRD)South SudanSpainSri LankaSt. Kitts and NevisSt. LuciaSt. Vincent and the GrenadinesSub-Saharan Africa Sub-Saharan Africa (excluding high income)Sub-Saharan Africa (IDA & IBRD countries)SudanSurinameSwazilandSwedenSwitzerlandSyrian Arab RepublicTajikistanTanzaniaThailandTimor-LesteTogoTongaTrinidad and TobagoTunisiaTurkeyTurkmenistanTuvaluUgandaUkraineUnited Arab EmiratesUnited KingdomUnited StatesUpper middle incomeUruguayUzbekistanVanuatuVenezuela, RBVietnamWest Bank and GazaWorldYemen, Rep.ZambiaZimbabwe Timeline:
This timeline shows a graph from 1971 to 2015 of Lesotho. No data until 1970. Number of actual observations by date: 44.
Source name:
World Development Indicators
Source organization:
United Nations Educational, Scientific, and Cultural Organization (UNESCO) Institute for Statistics.
Categories, topics:
Education, Gender
Last updated:
apr 23, 2017
Indicators value changes by year
Minimum:
68.376
jan 1, 1973
Maximum:
119.606
jan 1, 2004
At the date of observation
Value
Absolute change
Change from previous value
jan 1, 1971
71.028
+71.028
0.0%
jan 1, 1973
68.376
-2.652
-3.73%
jan 1, 1974
71.363
+2.988
4.37%
jan 1, 1975
81.072
+9.709
13.6%
jan 1, 1976
81.705
+0.633
0.78%
jan 1, 1977
80.118
-1.586
-1.94%
jan 1, 1978
78.957
-1.161
-1.45%
jan 1, 1979
77.234
-1.723
-2.18%
jan 1, 1980
78.074
+0.84
1.09%
jan 1, 1981
80.008
+1.934
2.48%
jan 1, 1982
83.693
+3.685
4.61%
jan 1, 1983
88.855
+5.162
6.17%
jan 1, 1984
90.935
+2.08
2.34%
jan 1, 1985
92.037
+1.102
1.21%
jan 1, 1986
95.348
+3.311
3.6%
jan 1, 1987
95.312
-0.037
-0.04%
jan 1, 1988
97.025
+1.714
1.8%
jan 1, 1989
99.305
+2.28
2.35%
jan 1, 1990
98.887
-0.418
-0.42%
jan 1, 1991
98.234
-0.653
-0.66%
jan 1, 1992
99.0
+0.766
0.78%
jan 1, 1993
99.228
+0.228
0.23%
jan 1, 1994
96.904
-2.325
-2.34%
jan 1, 1995
100.774
+3.87
3.99%
jan 1, 1996
104.33
+3.556
3.53%
jan 1, 1997
103.073
-1.257
-1.2%
jan 1, 1998
101.918
-1.155
-1.12%
jan 1, 1999
101.863
-0.055
-0.05%
jan 1, 2000
100.334
-1.529
-1.5%
jan 1, 2001
114.685
+14.351
14.3%
jan 1, 2002
116.598
+1.914
1.67%
jan 1, 2003
117.285
+0.686
0.59%
jan 1, 2004
119.606
+2.321
1.98%
jan 1, 2005
118.705
-0.901
-0.75%
jan 1, 2006
116.805
-1.9
-1.6%
jan 1, 2007
117.174
+0.369
0.32%
jan 1, 2008
111.071
-6.103
-5.21%
jan 1, 2009
110.443
-0.628
-0.57%
jan 1, 2010
109.296
-1.147
-1.04%
jan 1, 2011
111.548
+2.252
2.06%
jan 1, 2012
112.554
+1.006
0.9%
jan 1, 2013
112.352
-0.202
-0.18%
jan 1, 2014
109.018
-3.334
-2.97%
jan 1, 2015
108.323
-0.695
-0.64%
Ranking of countries by current statistics by years


Comments: