29
/
en
AIzaSyAYiBZKx7MnpbEhh9jyipgxe19OcubqV5w
April 1, 2024
94229
Bulgaria
BGR
true
2
1
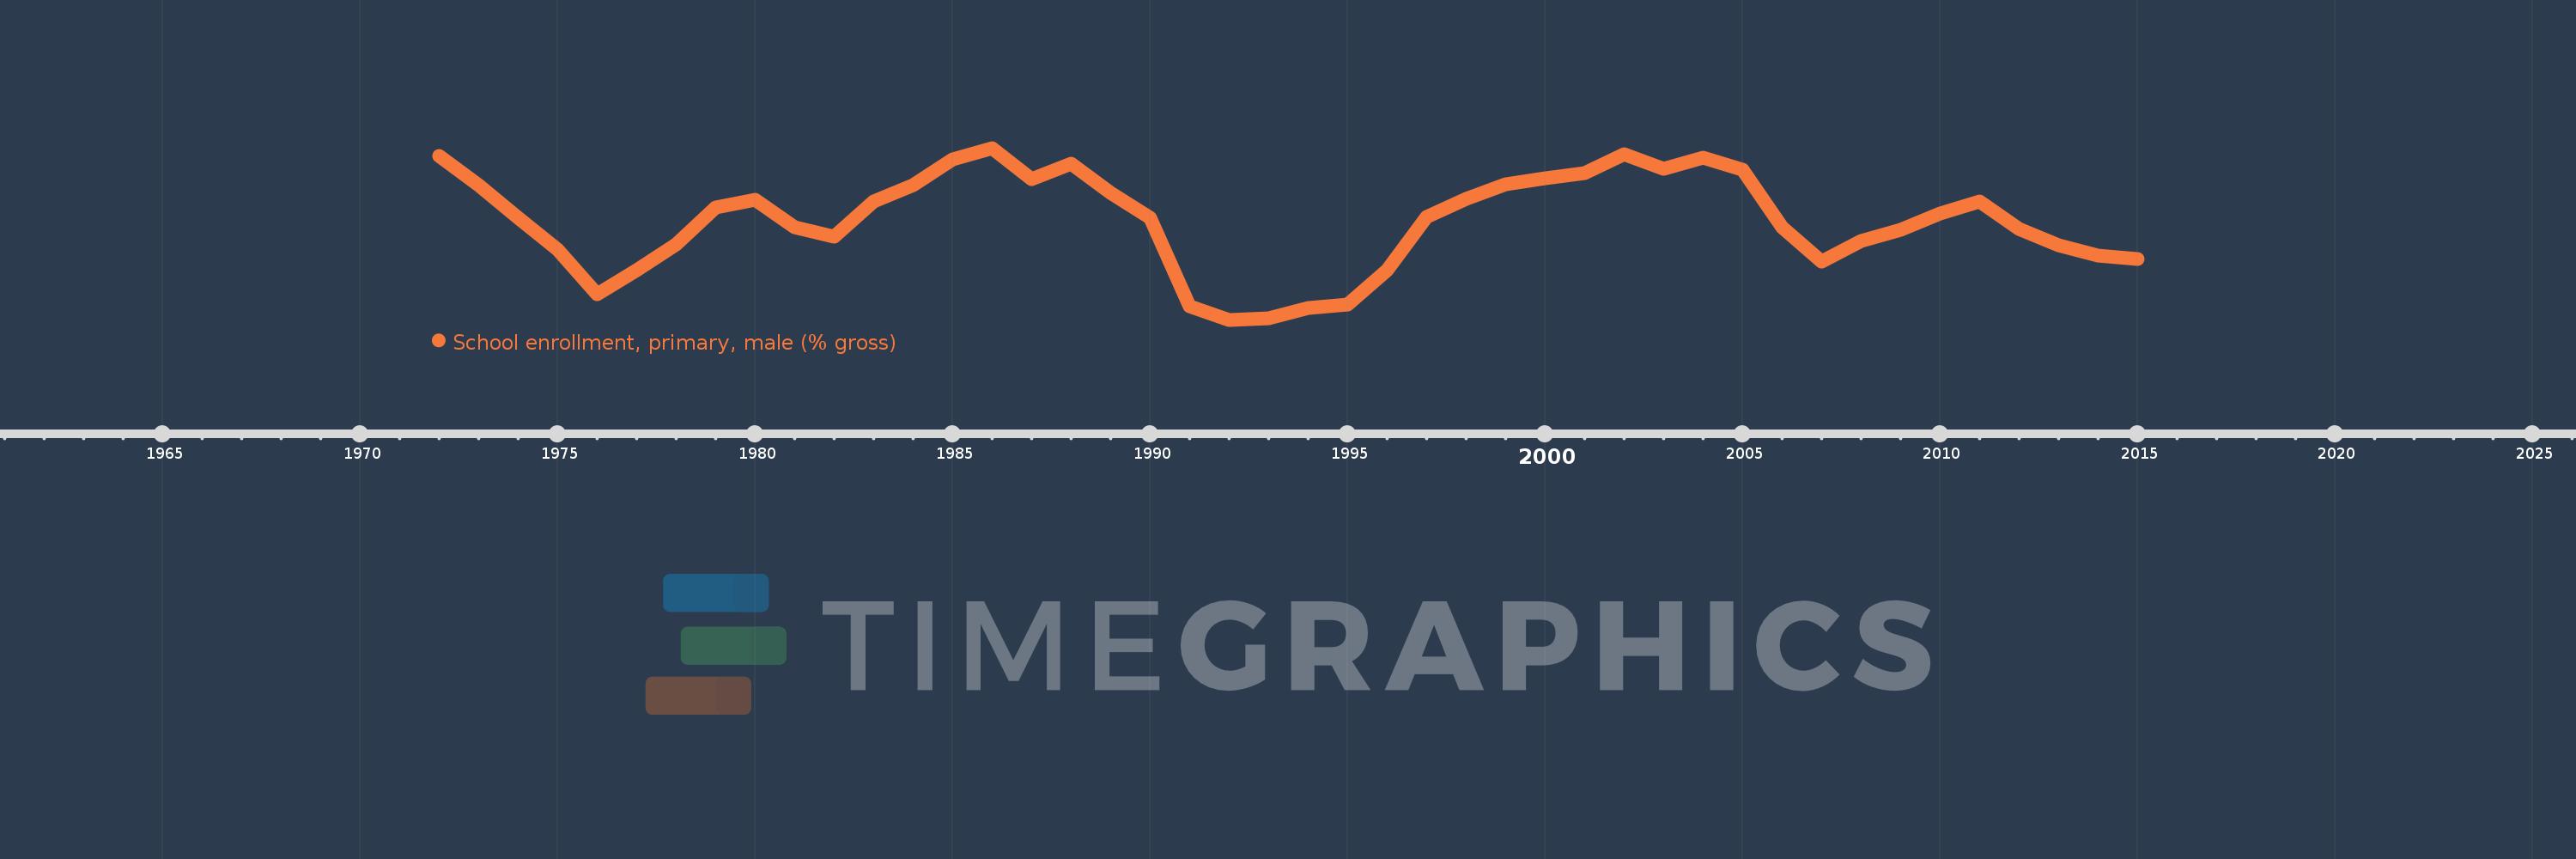
School enrollment, primary, male (% gross)
2015,2014,2013,2012,2011,2010,2009,2008,2007,2006,2005,2004,2003,2002,2001,2000,1999,1998,1997,1996,1995,1994,1993,1992,1991,1990,1989,1988,1987,1986,1985,1984,1983,1982,1981,1980,1979,1978,1977,1976,1975,1974,1973,1972
This statistics in other country:
AfghanistanAlbaniaAlgeriaAndorraAngolaAntigua and BarbudaArab WorldArgentinaArmeniaArubaAustraliaAustriaAzerbaijanBahamas, TheBahrainBangladeshBarbadosBelarusBelgiumBelizeBeninBermudaBhutanBoliviaBosnia and HerzegovinaBotswanaBrazilBrunei DarussalamBulgariaBurkina FasoBurundiCabo VerdeCambodiaCameroonCanadaCaribbean small statesCentral African RepublicCentral Europe and the BalticsChadChileChinaColombiaComorosCongo, Dem. Rep.Congo, Rep.Costa RicaCote d'IvoireCroatiaCubaCuracaoCyprusCzech RepublicDenmarkDjiboutiDominicaDominican RepublicEarly-demographic dividendEast Asia & PacificEast Asia & Pacific (excluding high income)East Asia & Pacific (IDA & IBRD countries)EcuadorEgypt, Arab Rep.El SalvadorEquatorial GuineaEritreaEstoniaEthiopiaEuro areaEurope & Central AsiaEurope & Central Asia (excluding high income)Europe & Central Asia (IDA & IBRD countries)European UnionFijiFinlandFragile and conflict affected situationsFranceGabonGambia, TheGeorgiaGermanyGhanaGreeceGrenadaGuatemalaGuineaGuinea-BissauGuyanaHaitiHeavily indebted poor countries (HIPC)High incomeHondurasHong Kong SAR, ChinaHungaryIBRD onlyIcelandIDA & IBRD totalIDA blendIDA onlyIDA totalIndiaIndonesiaIran, Islamic Rep.IraqIrelandIsraelItalyJamaicaJapanJordanKazakhstanKenyaKiribatiKorea, Dem. People’s Rep.Korea, Rep.KuwaitKyrgyz RepublicLao PDRLate-demographic dividendLatin America & Caribbean Latin America & Caribbean (excluding high income)Latin America & the Caribbean (IDA & IBRD countries)LatviaLeast developed countries: UN classificationLebanonLesothoLiberiaLibyaLiechtensteinLithuaniaLow & middle incomeLow incomeLower middle incomeLuxembourgMacao SAR, ChinaMacedonia, FYRMadagascarMalawiMaldivesMaliMaltaMarshall IslandsMauritaniaMauritiusMexicoMicronesia, Fed. Sts.Middle East & North AfricaMiddle East & North Africa (excluding high income)Middle East & North Africa (IDA & IBRD countries)Middle incomeMoldovaMongoliaMontenegroMoroccoMozambiqueMyanmarNamibiaNauruNepalNetherlandsNew ZealandNicaraguaNigerNigeriaNorth AmericaNorwayOECD membersOmanOther small statesPacific island small statesPakistanPalauPanamaPapua New GuineaParaguayPeruPhilippinesPolandPortugalPost-demographic dividendPre-demographic dividendPuerto RicoQatarRomaniaRussian FederationRwandaSamoaSan MarinoSao Tome and PrincipeSaudi ArabiaSenegalSerbiaSeychellesSierra LeoneSlovak RepublicSloveniaSmall statesSolomon IslandsSomaliaSouth AfricaSouth AsiaSouth Asia (IDA & IBRD)South SudanSpainSri LankaSt. Kitts and NevisSt. LuciaSt. Vincent and the GrenadinesSub-Saharan Africa Sub-Saharan Africa (excluding high income)Sub-Saharan Africa (IDA & IBRD countries)SudanSurinameSwazilandSwedenSwitzerlandSyrian Arab RepublicTajikistanTanzaniaThailandTimor-LesteTogoTongaTrinidad and TobagoTunisiaTurkeyTurkmenistanTuvaluUgandaUkraineUnited Arab EmiratesUnited KingdomUnited StatesUpper middle incomeUruguayUzbekistanVanuatuVenezuela, RBVietnamWest Bank and GazaWorldYemen, Rep.ZambiaZimbabwe Timeline:
This timeline shows a graph from 1972 to 2015 of Bulgaria. No data until 1971. Number of actual observations by date: 44.
Source name:
World Development Indicators
Source organization:
United Nations Educational, Scientific, and Cultural Organization (UNESCO) Institute for Statistics.
Categories, topics:
Education, Gender
Last updated:
apr 23, 2017
Indicators value changes by year
Maximum:
107.565
jan 1, 1986
At the date of observation
Value
Absolute change
Change from previous value
jan 1, 1972
106.973
+106.973
0.0%
jan 1, 1973
104.815
-2.158
-2.02%
jan 1, 1974
102.435
-2.38
-2.27%
jan 1, 1975
100.115
-2.32
-2.26%
jan 1, 1976
96.814
-3.301
-3.3%
jan 1, 1977
98.553
+1.739
1.8%
jan 1, 1978
100.486
+1.932
1.96%
jan 1, 1979
103.208
+2.722
2.71%
jan 1, 1980
103.739
+0.531
0.51%
jan 1, 1981
101.759
-1.98
-1.91%
jan 1, 1982
101.026
-0.733
-0.72%
jan 1, 1983
103.617
+2.591
2.56%
jan 1, 1984
104.819
+1.202
1.16%
jan 1, 1985
106.732
+1.913
1.82%
jan 1, 1986
107.565
+0.833
0.78%
jan 1, 1987
105.261
-2.304
-2.14%
jan 1, 1988
106.405
+1.144
1.09%
jan 1, 1989
104.247
-2.158
-2.03%
jan 1, 1990
102.407
-1.84
-1.76%
jan 1, 1991
95.927
-6.481
-6.33%
jan 1, 1992
94.93
-0.996
-1.04%
jan 1, 1993
95.039
+0.109
0.11%
jan 1, 1994
95.814
+0.775
0.82%
jan 1, 1995
96.063
+0.249
0.26%
jan 1, 1996
98.599
+2.535
2.64%
jan 1, 1997
102.5
+3.902
3.96%
jan 1, 1998
103.804
+1.303
1.27%
jan 1, 1999
104.889
+1.085
1.05%
jan 1, 2000
105.314
+0.425
0.41%
jan 1, 2001
105.723
+0.41
0.39%
jan 1, 2002
107.134
+1.41
1.33%
jan 1, 2003
106.033
-1.1
-1.03%
jan 1, 2004
106.875
+0.842
0.79%
jan 1, 2005
105.937
-0.938
-0.88%
jan 1, 2006
101.753
-4.185
-3.95%
jan 1, 2007
99.177
-2.576
-2.53%
jan 1, 2008
100.726
+1.55
1.56%
jan 1, 2009
101.515
+0.788
0.78%
jan 1, 2010
102.756
+1.241
1.22%
jan 1, 2011
103.614
+0.858
0.84%
jan 1, 2012
101.606
-2.008
-1.94%
jan 1, 2013
100.392
-1.213
-1.19%
jan 1, 2014
99.676
-0.717
-0.71%
jan 1, 2015
99.389
-0.287
-0.29%
Ranking of countries by current statistics by years


Comments: