29
/
en
AIzaSyAYiBZKx7MnpbEhh9jyipgxe19OcubqV5w
April 1, 2024
281654
Venezuela, RB
VEN
true
2
1
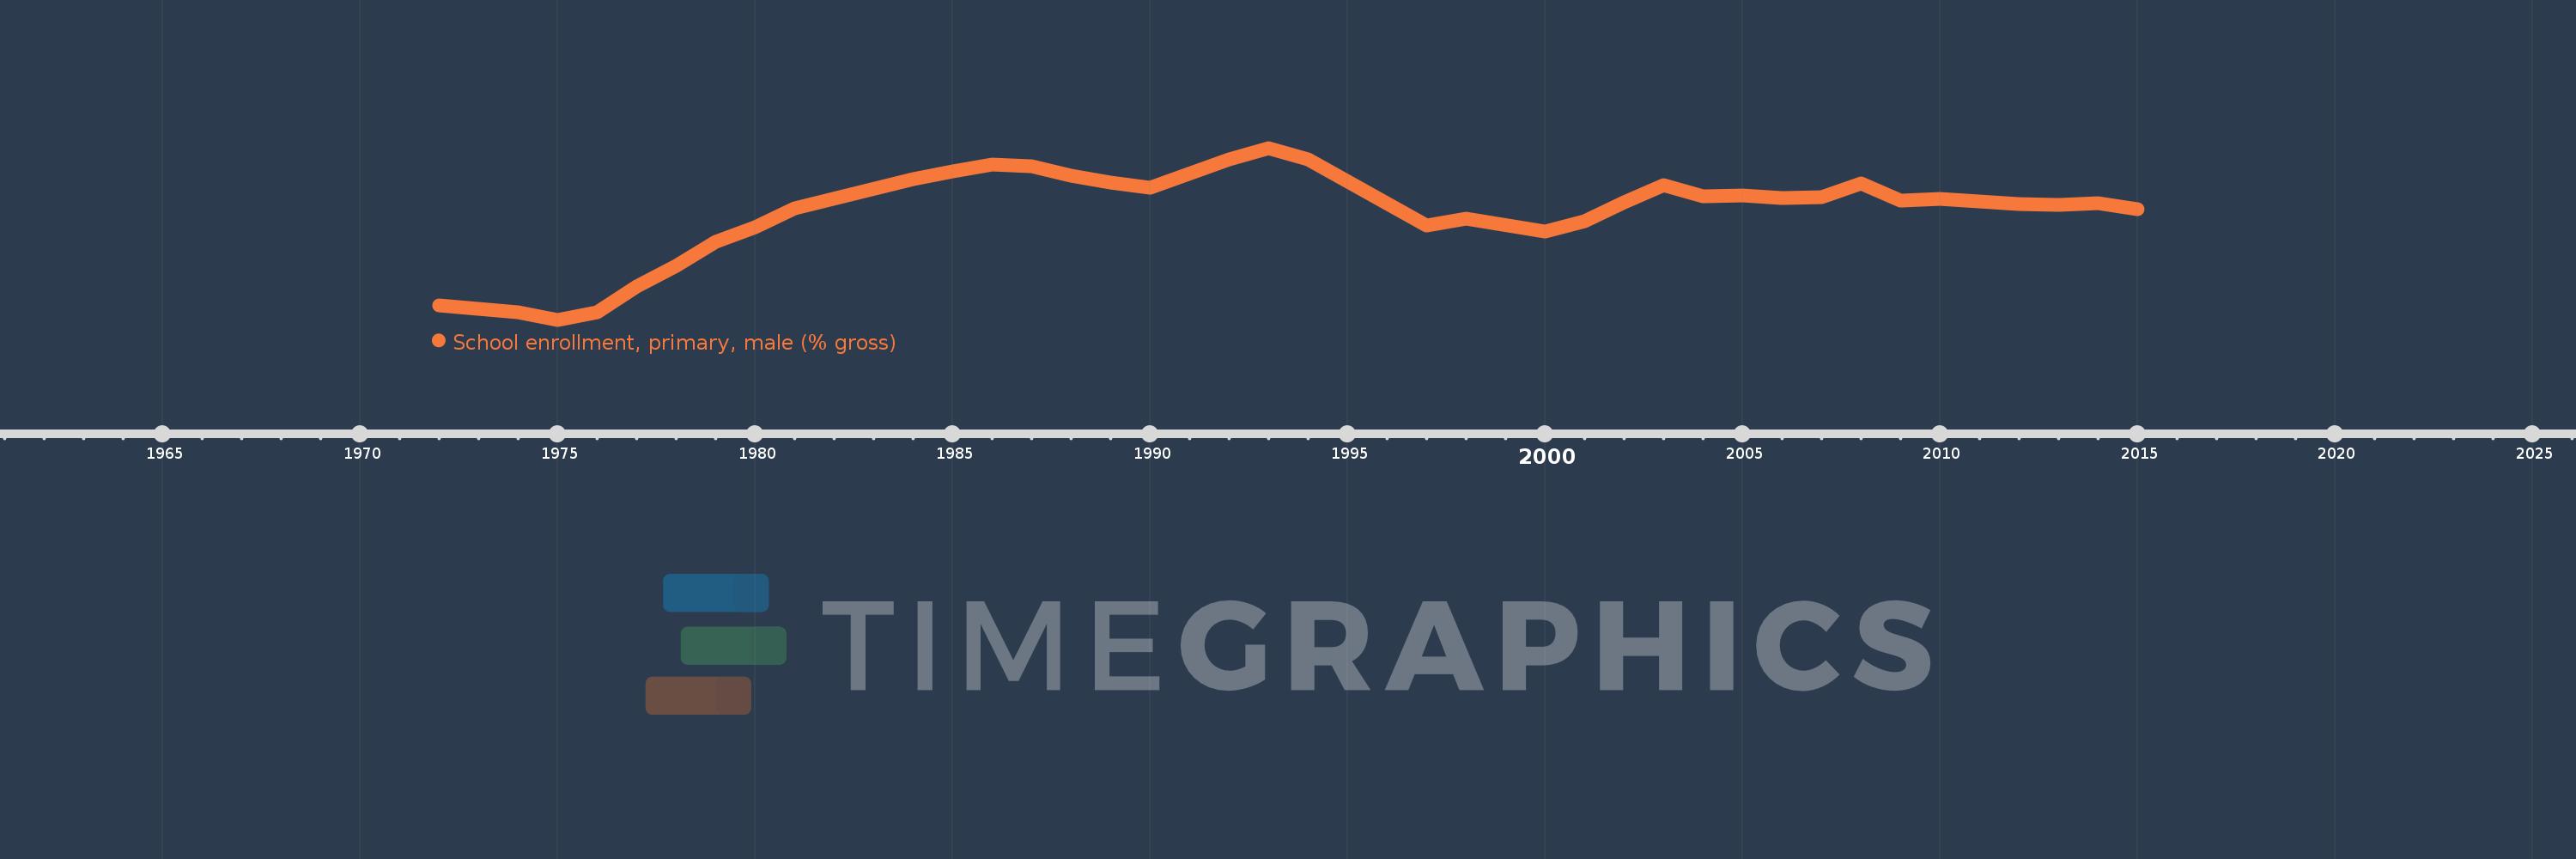
School enrollment, primary, male (% gross)
2015,2014,2013,2012,2011,2010,2009,2008,2007,2006,2005,2004,2003,2002,2001,2000,1998,1997,1994,1993,1992,1990,1989,1988,1987,1986,1985,1984,1981,1980,1979,1978,1977,1976,1975,1974,1973,1972
This statistics in other country:
AfghanistanAlbaniaAlgeriaAndorraAngolaAntigua and BarbudaArab WorldArgentinaArmeniaArubaAustraliaAustriaAzerbaijanBahamas, TheBahrainBangladeshBarbadosBelarusBelgiumBelizeBeninBermudaBhutanBoliviaBosnia and HerzegovinaBotswanaBrazilBrunei DarussalamBulgariaBurkina FasoBurundiCabo VerdeCambodiaCameroonCanadaCaribbean small statesCentral African RepublicCentral Europe and the BalticsChadChileChinaColombiaComorosCongo, Dem. Rep.Congo, Rep.Costa RicaCote d'IvoireCroatiaCubaCuracaoCyprusCzech RepublicDenmarkDjiboutiDominicaDominican RepublicEarly-demographic dividendEast Asia & PacificEast Asia & Pacific (excluding high income)East Asia & Pacific (IDA & IBRD countries)EcuadorEgypt, Arab Rep.El SalvadorEquatorial GuineaEritreaEstoniaEthiopiaEuro areaEurope & Central AsiaEurope & Central Asia (excluding high income)Europe & Central Asia (IDA & IBRD countries)European UnionFijiFinlandFragile and conflict affected situationsFranceGabonGambia, TheGeorgiaGermanyGhanaGreeceGrenadaGuatemalaGuineaGuinea-BissauGuyanaHaitiHeavily indebted poor countries (HIPC)High incomeHondurasHong Kong SAR, ChinaHungaryIBRD onlyIcelandIDA & IBRD totalIDA blendIDA onlyIDA totalIndiaIndonesiaIran, Islamic Rep.IraqIrelandIsraelItalyJamaicaJapanJordanKazakhstanKenyaKiribatiKorea, Dem. People’s Rep.Korea, Rep.KuwaitKyrgyz RepublicLao PDRLate-demographic dividendLatin America & Caribbean Latin America & Caribbean (excluding high income)Latin America & the Caribbean (IDA & IBRD countries)LatviaLeast developed countries: UN classificationLebanonLesothoLiberiaLibyaLiechtensteinLithuaniaLow & middle incomeLow incomeLower middle incomeLuxembourgMacao SAR, ChinaMacedonia, FYRMadagascarMalawiMaldivesMaliMaltaMarshall IslandsMauritaniaMauritiusMexicoMicronesia, Fed. Sts.Middle East & North AfricaMiddle East & North Africa (excluding high income)Middle East & North Africa (IDA & IBRD countries)Middle incomeMoldovaMongoliaMontenegroMoroccoMozambiqueMyanmarNamibiaNauruNepalNetherlandsNew ZealandNicaraguaNigerNigeriaNorth AmericaNorwayOECD membersOmanOther small statesPacific island small statesPakistanPalauPanamaPapua New GuineaParaguayPeruPhilippinesPolandPortugalPost-demographic dividendPre-demographic dividendPuerto RicoQatarRomaniaRussian FederationRwandaSamoaSan MarinoSao Tome and PrincipeSaudi ArabiaSenegalSerbiaSeychellesSierra LeoneSlovak RepublicSloveniaSmall statesSolomon IslandsSomaliaSouth AfricaSouth AsiaSouth Asia (IDA & IBRD)South SudanSpainSri LankaSt. Kitts and NevisSt. LuciaSt. Vincent and the GrenadinesSub-Saharan Africa Sub-Saharan Africa (excluding high income)Sub-Saharan Africa (IDA & IBRD countries)SudanSurinameSwazilandSwedenSwitzerlandSyrian Arab RepublicTajikistanTanzaniaThailandTimor-LesteTogoTongaTrinidad and TobagoTunisiaTurkeyTurkmenistanTuvaluUgandaUkraineUnited Arab EmiratesUnited KingdomUnited StatesUpper middle incomeUruguayUzbekistanVanuatuVenezuela, RBVietnamWest Bank and GazaWorldYemen, Rep.ZambiaZimbabwe Timeline:
This timeline shows a graph from 1972 to 2015 of Venezuela, RB. No data until 1971. Number of actual observations by date: 38.
Source name:
World Development Indicators
Source organization:
United Nations Educational, Scientific, and Cultural Organization (UNESCO) Institute for Statistics.
Categories, topics:
Education, Gender
Last updated:
apr 23, 2017
Indicators value changes by year
Minimum:
84.607
jan 1, 1975
Maximum:
111.581
jan 1, 1993
At the date of observation
Value
Absolute change
Change from previous value
jan 1, 1972
86.87
+86.87
0.0%
jan 1, 1973
86.382
-0.487
-0.56%
jan 1, 1974
85.741
-0.642
-0.74%
jan 1, 1975
84.607
-1.134
-1.32%
jan 1, 1976
85.778
+1.171
1.38%
jan 1, 1977
89.875
+4.097
4.78%
jan 1, 1978
93.096
+3.221
3.58%
jan 1, 1979
96.773
+3.677
3.95%
jan 1, 1980
99.137
+2.364
2.44%
jan 1, 1981
102.116
+2.98
3.01%
jan 1, 1984
106.64
+4.524
4.43%
jan 1, 1985
107.88
+1.24
1.16%
jan 1, 1986
109.003
+1.122
1.04%
jan 1, 1987
108.734
-0.268
-0.25%
jan 1, 1988
107.186
-1.549
-1.42%
jan 1, 1989
106.19
-0.996
-0.93%
jan 1, 1990
105.322
-0.868
-0.82%
jan 1, 1992
109.72
+4.398
4.18%
jan 1, 1993
111.581
+1.861
1.7%
jan 1, 1994
109.768
-1.813
-1.62%
jan 1, 1997
99.352
-10.416
-9.49%
jan 1, 1998
100.489
+1.137
1.14%
jan 1, 2000
98.424
-2.065
-2.06%
jan 1, 2001
100.12
+1.696
1.72%
jan 1, 2002
103.1
+2.98
2.98%
jan 1, 2003
105.705
+2.606
2.53%
jan 1, 2004
104.017
-1.688
-1.6%
jan 1, 2005
104.082
+0.065
0.06%
jan 1, 2006
103.769
-0.313
-0.3%
jan 1, 2007
103.894
+0.125
0.12%
jan 1, 2008
105.968
+2.074
2.0%
jan 1, 2009
103.261
-2.707
-2.55%
jan 1, 2010
103.619
+0.357
0.35%
jan 1, 2011
103.146
-0.473
-0.46%
jan 1, 2012
102.779
-0.367
-0.36%
jan 1, 2013
102.642
-0.137
-0.13%
jan 1, 2014
102.882
+0.239
0.23%
jan 1, 2015
101.944
-0.937
-0.91%
Ranking of countries by current statistics by years


Comments: