29
/
en
AIzaSyAYiBZKx7MnpbEhh9jyipgxe19OcubqV5w
April 1, 2024
41896
Latin America & Caribbean
LCN
false
2
1
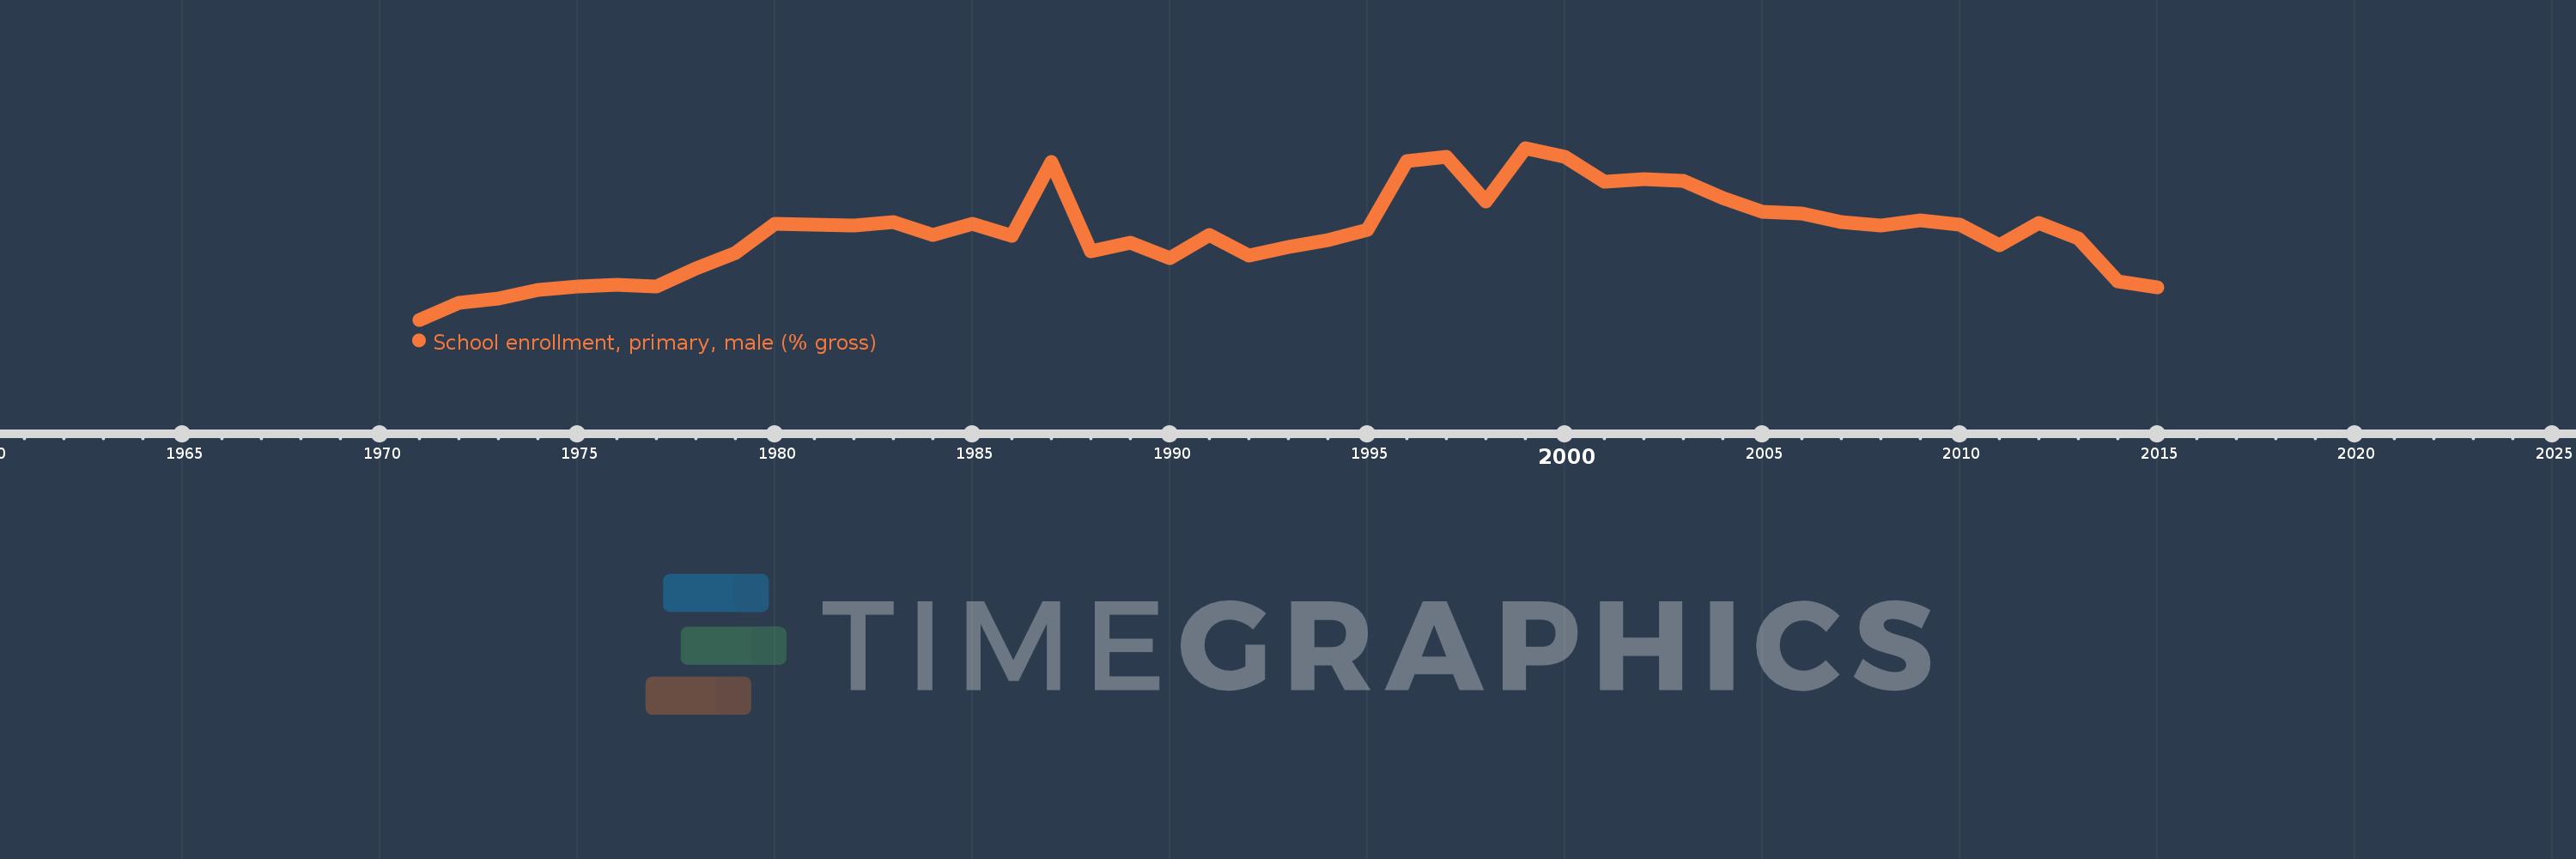
School enrollment, primary, male (% gross)
2015,2014,2013,2012,2011,2010,2009,2008,2007,2006,2005,2004,2003,2002,2001,2000,1999,1998,1997,1996,1995,1994,1993,1992,1991,1990,1989,1988,1987,1986,1985,1984,1983,1982,1981,1980,1979,1978,1977,1976,1975,1974,1973,1972,1971
This statistics in other country:
AfghanistanAlbaniaAlgeriaAndorraAngolaAntigua and BarbudaArab WorldArgentinaArmeniaArubaAustraliaAustriaAzerbaijanBahamas, TheBahrainBangladeshBarbadosBelarusBelgiumBelizeBeninBermudaBhutanBoliviaBosnia and HerzegovinaBotswanaBrazilBrunei DarussalamBulgariaBurkina FasoBurundiCabo VerdeCambodiaCameroonCanadaCaribbean small statesCentral African RepublicCentral Europe and the BalticsChadChileChinaColombiaComorosCongo, Dem. Rep.Congo, Rep.Costa RicaCote d'IvoireCroatiaCubaCuracaoCyprusCzech RepublicDenmarkDjiboutiDominicaDominican RepublicEarly-demographic dividendEast Asia & PacificEast Asia & Pacific (excluding high income)East Asia & Pacific (IDA & IBRD countries)EcuadorEgypt, Arab Rep.El SalvadorEquatorial GuineaEritreaEstoniaEthiopiaEuro areaEurope & Central AsiaEurope & Central Asia (excluding high income)Europe & Central Asia (IDA & IBRD countries)European UnionFijiFinlandFragile and conflict affected situationsFranceGabonGambia, TheGeorgiaGermanyGhanaGreeceGrenadaGuatemalaGuineaGuinea-BissauGuyanaHaitiHeavily indebted poor countries (HIPC)High incomeHondurasHong Kong SAR, ChinaHungaryIBRD onlyIcelandIDA & IBRD totalIDA blendIDA onlyIDA totalIndiaIndonesiaIran, Islamic Rep.IraqIrelandIsraelItalyJamaicaJapanJordanKazakhstanKenyaKiribatiKorea, Dem. People’s Rep.Korea, Rep.KuwaitKyrgyz RepublicLao PDRLate-demographic dividendLatin America & Caribbean Latin America & Caribbean (excluding high income)Latin America & the Caribbean (IDA & IBRD countries)LatviaLeast developed countries: UN classificationLebanonLesothoLiberiaLibyaLiechtensteinLithuaniaLow & middle incomeLow incomeLower middle incomeLuxembourgMacao SAR, ChinaMacedonia, FYRMadagascarMalawiMaldivesMaliMaltaMarshall IslandsMauritaniaMauritiusMexicoMicronesia, Fed. Sts.Middle East & North AfricaMiddle East & North Africa (excluding high income)Middle East & North Africa (IDA & IBRD countries)Middle incomeMoldovaMongoliaMontenegroMoroccoMozambiqueMyanmarNamibiaNauruNepalNetherlandsNew ZealandNicaraguaNigerNigeriaNorth AmericaNorwayOECD membersOmanOther small statesPacific island small statesPakistanPalauPanamaPapua New GuineaParaguayPeruPhilippinesPolandPortugalPost-demographic dividendPre-demographic dividendPuerto RicoQatarRomaniaRussian FederationRwandaSamoaSan MarinoSao Tome and PrincipeSaudi ArabiaSenegalSerbiaSeychellesSierra LeoneSlovak RepublicSloveniaSmall statesSolomon IslandsSomaliaSouth AfricaSouth AsiaSouth Asia (IDA & IBRD)South SudanSpainSri LankaSt. Kitts and NevisSt. LuciaSt. Vincent and the GrenadinesSub-Saharan Africa Sub-Saharan Africa (excluding high income)Sub-Saharan Africa (IDA & IBRD countries)SudanSurinameSwazilandSwedenSwitzerlandSyrian Arab RepublicTajikistanTanzaniaThailandTimor-LesteTogoTongaTrinidad and TobagoTunisiaTurkeyTurkmenistanTuvaluUgandaUkraineUnited Arab EmiratesUnited KingdomUnited StatesUpper middle incomeUruguayUzbekistanVanuatuVenezuela, RBVietnamWest Bank and GazaWorldYemen, Rep.ZambiaZimbabwe Timeline:
This timeline shows a graph from 1971 to 2015 of Latin America & Caribbean . No data until 1970. Number of actual observations by date: 45.
Source name:
World Development Indicators
Source organization:
United Nations Educational, Scientific, and Cultural Organization (UNESCO) Institute for Statistics.
Categories, topics:
Education, Gender
Last updated:
apr 23, 2017
Indicators value changes by year
Minimum:
106.137
jan 1, 1971
Maximum:
124.504
jan 1, 1999
At the date of observation
Value
Absolute change
Change from previous value
jan 1, 1971
106.137
+106.137
0.0%
jan 1, 1972
107.944
+1.807
1.7%
jan 1, 1973
108.417
+0.473
0.44%
jan 1, 1974
109.328
+0.911
0.84%
jan 1, 1975
109.701
+0.372
0.34%
jan 1, 1976
109.856
+0.155
0.14%
jan 1, 1977
109.661
-0.195
-0.18%
jan 1, 1978
111.662
+2.001
1.82%
jan 1, 1979
113.295
+1.633
1.46%
jan 1, 1980
116.418
+3.123
2.76%
jan 1, 1981
116.338
-0.08
-0.07%
jan 1, 1982
116.212
-0.126
-0.11%
jan 1, 1983
116.564
+0.352
0.3%
jan 1, 1984
115.18
-1.384
-1.19%
jan 1, 1985
116.398
+1.218
1.06%
jan 1, 1986
115.115
-1.283
-1.1%
jan 1, 1987
123.025
+7.91
6.87%
jan 1, 1988
113.479
-9.545
-7.76%
jan 1, 1989
114.413
+0.934
0.82%
jan 1, 1990
112.72
-1.693
-1.48%
jan 1, 1991
115.172
+2.451
2.17%
jan 1, 1992
113.018
-2.154
-1.87%
jan 1, 1993
113.898
+0.88
0.78%
jan 1, 1994
114.682
+0.784
0.69%
jan 1, 1995
115.771
+1.088
0.95%
jan 1, 1996
123.122
+7.351
6.35%
jan 1, 1997
123.544
+0.422
0.34%
jan 1, 1998
118.775
-4.769
-3.86%
jan 1, 1999
124.504
+5.728
4.82%
jan 1, 2000
123.57
-0.934
-0.75%
jan 1, 2001
120.893
-2.677
-2.17%
jan 1, 2002
121.214
+0.32
0.27%
jan 1, 2003
121.008
-0.206
-0.17%
jan 1, 2004
119.124
-1.884
-1.56%
jan 1, 2005
117.696
-1.427
-1.2%
jan 1, 2006
117.454
-0.243
-0.21%
jan 1, 2007
116.553
-0.901
-0.77%
jan 1, 2008
116.189
-0.364
-0.31%
jan 1, 2009
116.732
+0.543
0.47%
jan 1, 2010
116.266
-0.466
-0.4%
jan 1, 2011
114.115
-2.15
-1.85%
jan 1, 2012
116.508
+2.393
2.1%
jan 1, 2013
114.874
-1.634
-1.4%
jan 1, 2014
110.226
-4.649
-4.05%
jan 1, 2015
109.559
-0.667
-0.61%
Ranking of countries by current statistics by years


Comments: