29
/
en
AIzaSyAYiBZKx7MnpbEhh9jyipgxe19OcubqV5w
April 1, 2024
117390
Cyprus
CYP
true
2
1
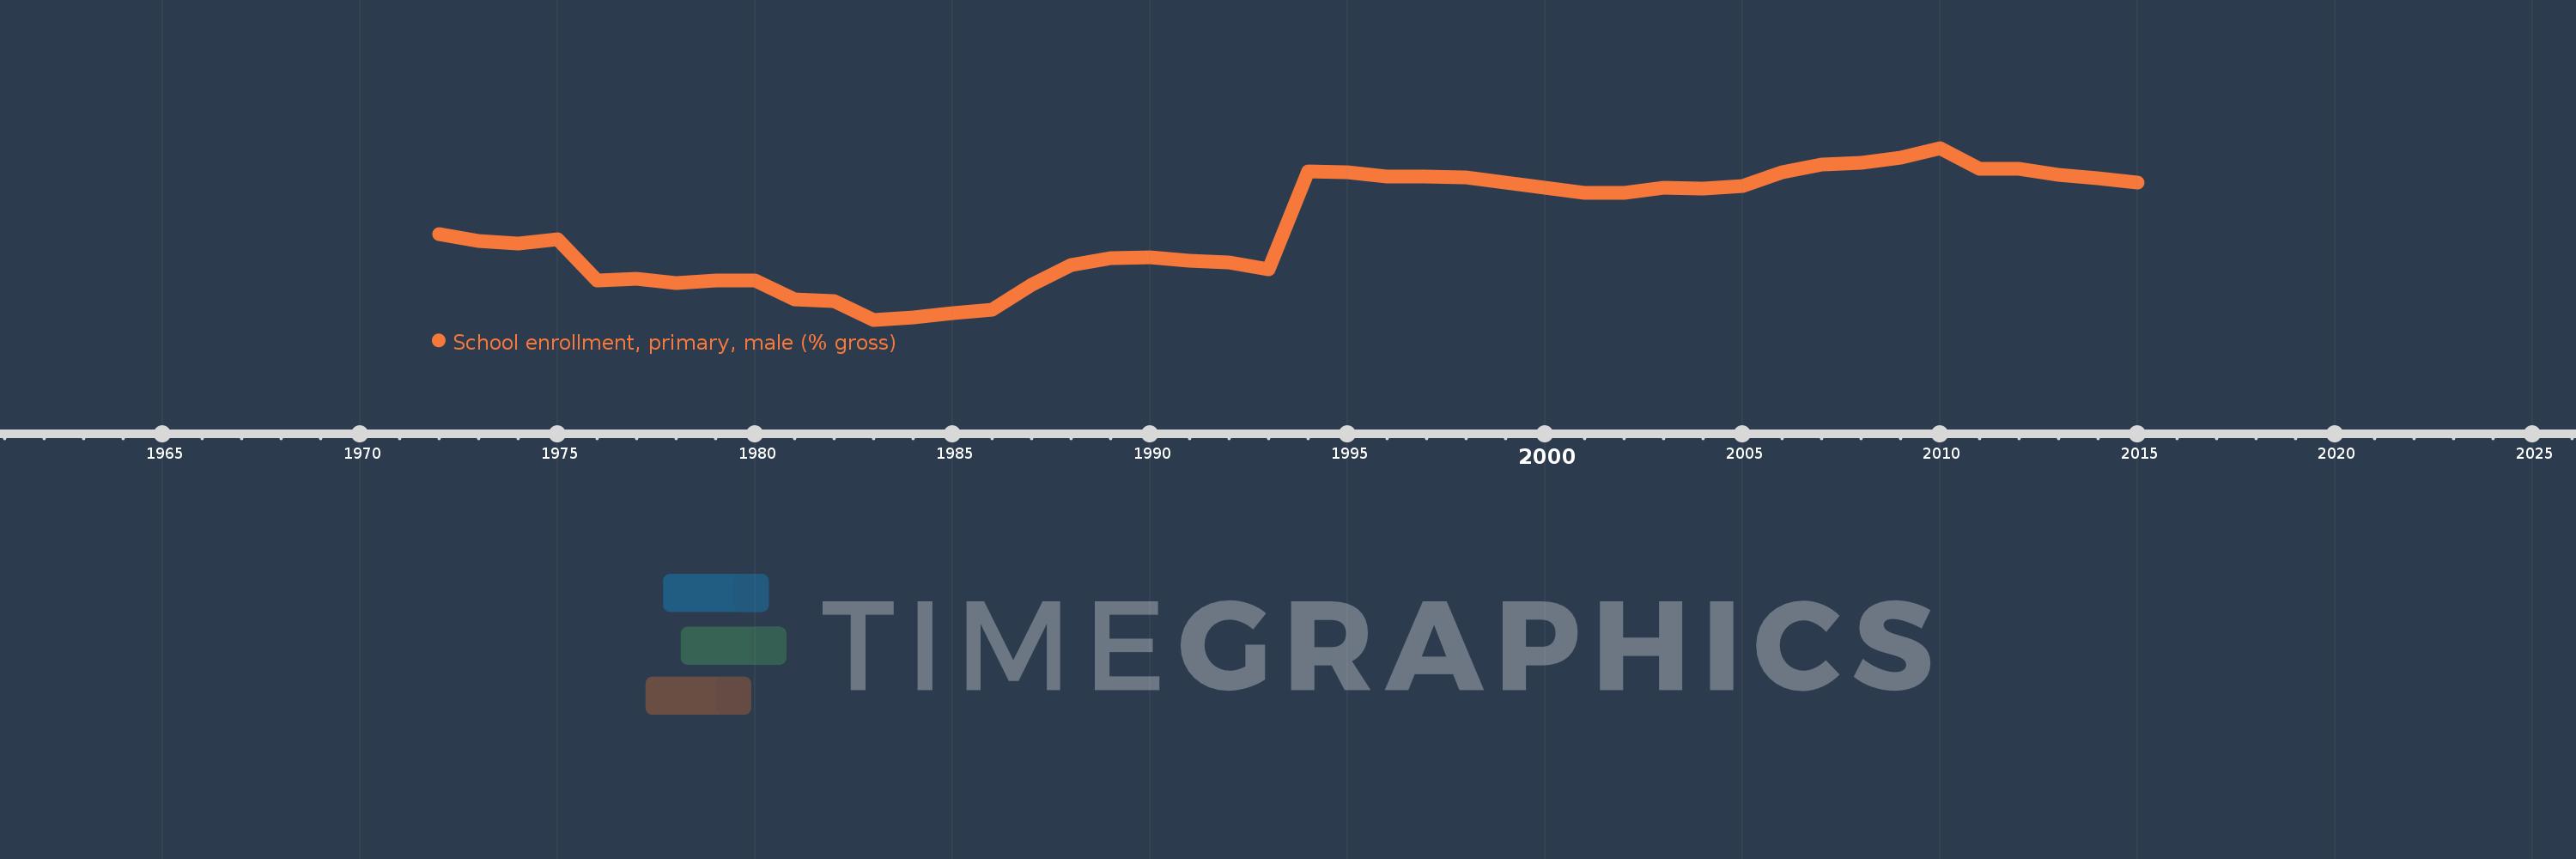
School enrollment, primary, male (% gross)
2015,2014,2013,2012,2011,2010,2009,2008,2007,2006,2005,2004,2003,2002,2001,2000,1998,1997,1996,1995,1994,1993,1992,1991,1990,1989,1988,1987,1986,1985,1984,1983,1982,1981,1980,1979,1978,1977,1976,1975,1974,1973,1972
This statistics in other country:
AfghanistanAlbaniaAlgeriaAndorraAngolaAntigua and BarbudaArab WorldArgentinaArmeniaArubaAustraliaAustriaAzerbaijanBahamas, TheBahrainBangladeshBarbadosBelarusBelgiumBelizeBeninBermudaBhutanBoliviaBosnia and HerzegovinaBotswanaBrazilBrunei DarussalamBulgariaBurkina FasoBurundiCabo VerdeCambodiaCameroonCanadaCaribbean small statesCentral African RepublicCentral Europe and the BalticsChadChileChinaColombiaComorosCongo, Dem. Rep.Congo, Rep.Costa RicaCote d'IvoireCroatiaCubaCuracaoCyprusCzech RepublicDenmarkDjiboutiDominicaDominican RepublicEarly-demographic dividendEast Asia & PacificEast Asia & Pacific (excluding high income)East Asia & Pacific (IDA & IBRD countries)EcuadorEgypt, Arab Rep.El SalvadorEquatorial GuineaEritreaEstoniaEthiopiaEuro areaEurope & Central AsiaEurope & Central Asia (excluding high income)Europe & Central Asia (IDA & IBRD countries)European UnionFijiFinlandFragile and conflict affected situationsFranceGabonGambia, TheGeorgiaGermanyGhanaGreeceGrenadaGuatemalaGuineaGuinea-BissauGuyanaHaitiHeavily indebted poor countries (HIPC)High incomeHondurasHong Kong SAR, ChinaHungaryIBRD onlyIcelandIDA & IBRD totalIDA blendIDA onlyIDA totalIndiaIndonesiaIran, Islamic Rep.IraqIrelandIsraelItalyJamaicaJapanJordanKazakhstanKenyaKiribatiKorea, Dem. People’s Rep.Korea, Rep.KuwaitKyrgyz RepublicLao PDRLate-demographic dividendLatin America & Caribbean Latin America & Caribbean (excluding high income)Latin America & the Caribbean (IDA & IBRD countries)LatviaLeast developed countries: UN classificationLebanonLesothoLiberiaLibyaLiechtensteinLithuaniaLow & middle incomeLow incomeLower middle incomeLuxembourgMacao SAR, ChinaMacedonia, FYRMadagascarMalawiMaldivesMaliMaltaMarshall IslandsMauritaniaMauritiusMexicoMicronesia, Fed. Sts.Middle East & North AfricaMiddle East & North Africa (excluding high income)Middle East & North Africa (IDA & IBRD countries)Middle incomeMoldovaMongoliaMontenegroMoroccoMozambiqueMyanmarNamibiaNauruNepalNetherlandsNew ZealandNicaraguaNigerNigeriaNorth AmericaNorwayOECD membersOmanOther small statesPacific island small statesPakistanPalauPanamaPapua New GuineaParaguayPeruPhilippinesPolandPortugalPost-demographic dividendPre-demographic dividendPuerto RicoQatarRomaniaRussian FederationRwandaSamoaSan MarinoSao Tome and PrincipeSaudi ArabiaSenegalSerbiaSeychellesSierra LeoneSlovak RepublicSloveniaSmall statesSolomon IslandsSomaliaSouth AfricaSouth AsiaSouth Asia (IDA & IBRD)South SudanSpainSri LankaSt. Kitts and NevisSt. LuciaSt. Vincent and the GrenadinesSub-Saharan Africa Sub-Saharan Africa (excluding high income)Sub-Saharan Africa (IDA & IBRD countries)SudanSurinameSwazilandSwedenSwitzerlandSyrian Arab RepublicTajikistanTanzaniaThailandTimor-LesteTogoTongaTrinidad and TobagoTunisiaTurkeyTurkmenistanTuvaluUgandaUkraineUnited Arab EmiratesUnited KingdomUnited StatesUpper middle incomeUruguayUzbekistanVanuatuVenezuela, RBVietnamWest Bank and GazaWorldYemen, Rep.ZambiaZimbabwe Timeline:
This timeline shows a graph from 1972 to 2015 of Cyprus. No data until 1971. Number of actual observations by date: 43.
Source name:
World Development Indicators
Source organization:
United Nations Educational, Scientific, and Cultural Organization (UNESCO) Institute for Statistics.
Categories, topics:
Education, Gender
Last updated:
apr 23, 2017
Indicators value changes by year
Minimum:
70.129
jan 1, 1983
Maximum:
105.942
jan 1, 2010
At the date of observation
Value
Absolute change
Change from previous value
jan 1, 1972
87.899
+87.899
0.0%
jan 1, 1973
86.582
-1.317
-1.5%
jan 1, 1974
86.072
-0.511
-0.59%
jan 1, 1975
86.931
+0.859
1.0%
jan 1, 1976
78.368
-8.563
-9.85%
jan 1, 1977
78.712
+0.344
0.44%
jan 1, 1978
77.781
-0.931
-1.18%
jan 1, 1979
78.4
+0.619
0.8%
jan 1, 1980
78.381
-0.019
-0.02%
jan 1, 1981
74.407
-3.974
-5.07%
jan 1, 1982
73.934
-0.474
-0.64%
jan 1, 1983
70.129
-3.805
-5.15%
jan 1, 1984
70.675
+0.546
0.78%
jan 1, 1985
71.434
+0.759
1.07%
jan 1, 1986
72.183
+0.749
1.05%
jan 1, 1987
77.414
+5.231
7.25%
jan 1, 1988
81.481
+4.067
5.25%
jan 1, 1989
82.983
+1.502
1.84%
jan 1, 1990
83.228
+0.245
0.3%
jan 1, 1991
82.442
-0.786
-0.94%
jan 1, 1992
82.034
-0.408
-0.49%
jan 1, 1993
80.681
-1.352
-1.65%
jan 1, 1994
101.099
+20.418
25.31%
jan 1, 1995
100.803
-0.296
-0.29%
jan 1, 1996
100.048
-0.755
-0.75%
jan 1, 1997
100.051
+0.003
0.0%
jan 1, 1998
99.755
-0.296
-0.3%
jan 1, 2000
97.644
-2.111
-2.12%
jan 1, 2001
96.649
-0.995
-1.02%
jan 1, 2002
96.539
-0.11
-0.11%
jan 1, 2003
97.699
+1.16
1.2%
jan 1, 2004
97.441
-0.258
-0.26%
jan 1, 2005
97.981
+0.54
0.55%
jan 1, 2006
100.921
+2.941
3.0%
jan 1, 2007
102.537
+1.615
1.6%
jan 1, 2008
102.85
+0.313
0.31%
jan 1, 2009
103.931
+1.081
1.05%
jan 1, 2010
105.942
+2.011
1.94%
jan 1, 2011
101.615
-4.327
-4.08%
jan 1, 2012
101.586
-0.03
-0.03%
jan 1, 2013
100.288
-1.298
-1.28%
jan 1, 2014
99.652
-0.635
-0.63%
jan 1, 2015
98.746
-0.906
-0.91%
Ranking of countries by current statistics by years


Comments: