29
/
en
AIzaSyAYiBZKx7MnpbEhh9jyipgxe19OcubqV5w
April 1, 2024
276142
United Kingdom
GBR
true
2
1
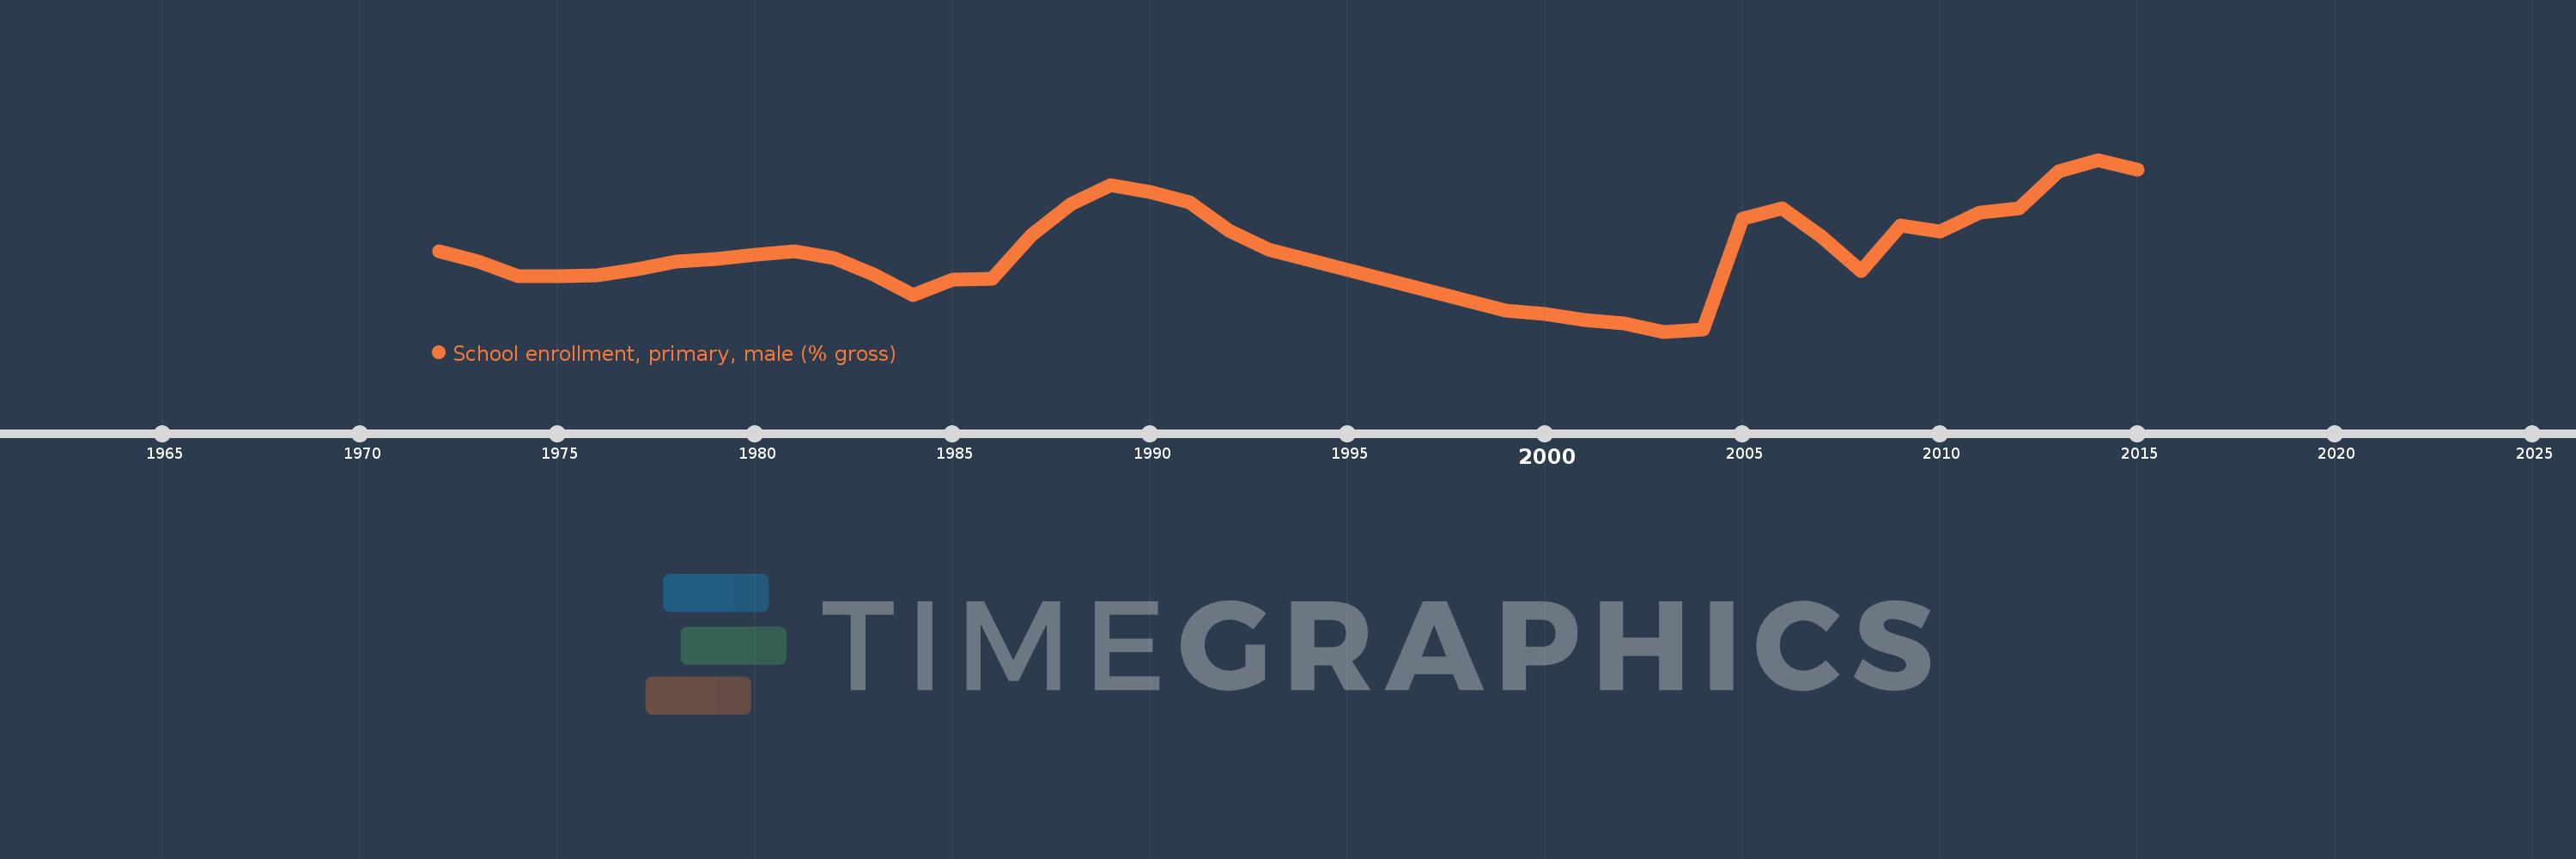
School enrollment, primary, male (% gross)
2015,2014,2013,2012,2011,2010,2009,2008,2007,2006,2005,2004,2003,2002,2001,2000,1999,1993,1992,1991,1990,1989,1988,1987,1986,1985,1984,1983,1982,1981,1980,1979,1978,1977,1976,1975,1974,1973,1972
This statistics in other country:
AfghanistanAlbaniaAlgeriaAndorraAngolaAntigua and BarbudaArab WorldArgentinaArmeniaArubaAustraliaAustriaAzerbaijanBahamas, TheBahrainBangladeshBarbadosBelarusBelgiumBelizeBeninBermudaBhutanBoliviaBosnia and HerzegovinaBotswanaBrazilBrunei DarussalamBulgariaBurkina FasoBurundiCabo VerdeCambodiaCameroonCanadaCaribbean small statesCentral African RepublicCentral Europe and the BalticsChadChileChinaColombiaComorosCongo, Dem. Rep.Congo, Rep.Costa RicaCote d'IvoireCroatiaCubaCuracaoCyprusCzech RepublicDenmarkDjiboutiDominicaDominican RepublicEarly-demographic dividendEast Asia & PacificEast Asia & Pacific (excluding high income)East Asia & Pacific (IDA & IBRD countries)EcuadorEgypt, Arab Rep.El SalvadorEquatorial GuineaEritreaEstoniaEthiopiaEuro areaEurope & Central AsiaEurope & Central Asia (excluding high income)Europe & Central Asia (IDA & IBRD countries)European UnionFijiFinlandFragile and conflict affected situationsFranceGabonGambia, TheGeorgiaGermanyGhanaGreeceGrenadaGuatemalaGuineaGuinea-BissauGuyanaHaitiHeavily indebted poor countries (HIPC)High incomeHondurasHong Kong SAR, ChinaHungaryIBRD onlyIcelandIDA & IBRD totalIDA blendIDA onlyIDA totalIndiaIndonesiaIran, Islamic Rep.IraqIrelandIsraelItalyJamaicaJapanJordanKazakhstanKenyaKiribatiKorea, Dem. People’s Rep.Korea, Rep.KuwaitKyrgyz RepublicLao PDRLate-demographic dividendLatin America & Caribbean Latin America & Caribbean (excluding high income)Latin America & the Caribbean (IDA & IBRD countries)LatviaLeast developed countries: UN classificationLebanonLesothoLiberiaLibyaLiechtensteinLithuaniaLow & middle incomeLow incomeLower middle incomeLuxembourgMacao SAR, ChinaMacedonia, FYRMadagascarMalawiMaldivesMaliMaltaMarshall IslandsMauritaniaMauritiusMexicoMicronesia, Fed. Sts.Middle East & North AfricaMiddle East & North Africa (excluding high income)Middle East & North Africa (IDA & IBRD countries)Middle incomeMoldovaMongoliaMontenegroMoroccoMozambiqueMyanmarNamibiaNauruNepalNetherlandsNew ZealandNicaraguaNigerNigeriaNorth AmericaNorwayOECD membersOmanOther small statesPacific island small statesPakistanPalauPanamaPapua New GuineaParaguayPeruPhilippinesPolandPortugalPost-demographic dividendPre-demographic dividendPuerto RicoQatarRomaniaRussian FederationRwandaSamoaSan MarinoSao Tome and PrincipeSaudi ArabiaSenegalSerbiaSeychellesSierra LeoneSlovak RepublicSloveniaSmall statesSolomon IslandsSomaliaSouth AfricaSouth AsiaSouth Asia (IDA & IBRD)South SudanSpainSri LankaSt. Kitts and NevisSt. LuciaSt. Vincent and the GrenadinesSub-Saharan Africa Sub-Saharan Africa (excluding high income)Sub-Saharan Africa (IDA & IBRD countries)SudanSurinameSwazilandSwedenSwitzerlandSyrian Arab RepublicTajikistanTanzaniaThailandTimor-LesteTogoTongaTrinidad and TobagoTunisiaTurkeyTurkmenistanTuvaluUgandaUkraineUnited Arab EmiratesUnited KingdomUnited StatesUpper middle incomeUruguayUzbekistanVanuatuVenezuela, RBVietnamWest Bank and GazaWorldYemen, Rep.ZambiaZimbabwe Timeline:
This timeline shows a graph from 1972 to 2015 of United Kingdom. No data until 1971. Number of actual observations by date: 39.
Source name:
World Development Indicators
Source organization:
United Nations Educational, Scientific, and Cultural Organization (UNESCO) Institute for Statistics.
Categories, topics:
Education, Gender
Last updated:
apr 23, 2017
Indicators value changes by year
Minimum:
99.735
jan 1, 2003
Maximum:
108.926
jan 1, 2014
At the date of observation
Value
Absolute change
Change from previous value
jan 1, 1972
104.04
+104.04
0.0%
jan 1, 1973
103.48
-0.56
-0.54%
jan 1, 1974
102.704
-0.776
-0.75%
jan 1, 1975
102.699
-0.004
0.0%
jan 1, 1976
102.753
+0.053
0.05%
jan 1, 1977
103.077
+0.324
0.32%
jan 1, 1978
103.498
+0.421
0.41%
jan 1, 1979
103.628
+0.13
0.13%
jan 1, 1980
103.864
+0.236
0.23%
jan 1, 1981
104.043
+0.178
0.17%
jan 1, 1982
103.683
-0.36
-0.35%
jan 1, 1983
102.808
-0.875
-0.84%
jan 1, 1984
101.667
-1.141
-1.11%
jan 1, 1985
102.538
+0.871
0.86%
jan 1, 1986
102.563
+0.024
0.02%
jan 1, 1987
104.884
+2.322
2.26%
jan 1, 1988
106.551
+1.667
1.59%
jan 1, 1989
107.589
+1.038
0.97%
jan 1, 1990
107.19
-0.398
-0.37%
jan 1, 1991
106.633
-0.557
-0.52%
jan 1, 1992
105.155
-1.478
-1.39%
jan 1, 1993
104.115
-1.039
-0.99%
jan 1, 1999
100.875
-3.241
-3.11%
jan 1, 2000
100.668
-0.207
-0.21%
jan 1, 2001
100.356
-0.311
-0.31%
jan 1, 2002
100.186
-0.171
-0.17%
jan 1, 2003
99.735
-0.451
-0.45%
jan 1, 2004
99.834
+0.099
0.1%
jan 1, 2005
105.78
+5.946
5.96%
jan 1, 2006
106.329
+0.549
0.52%
jan 1, 2007
104.811
-1.518
-1.43%
jan 1, 2008
102.977
-1.834
-1.75%
jan 1, 2009
105.413
+2.437
2.37%
jan 1, 2010
105.073
-0.34
-0.32%
jan 1, 2011
106.118
+1.045
0.99%
jan 1, 2012
106.346
+0.228
0.21%
jan 1, 2013
108.316
+1.97
1.85%
jan 1, 2014
108.926
+0.611
0.56%
jan 1, 2015
108.394
-0.532
-0.49%
Ranking of countries by current statistics by years


Comments: