29
/
en
AIzaSyAYiBZKx7MnpbEhh9jyipgxe19OcubqV5w
April 1, 2024
141095
Ghana
GHA
true
2
1
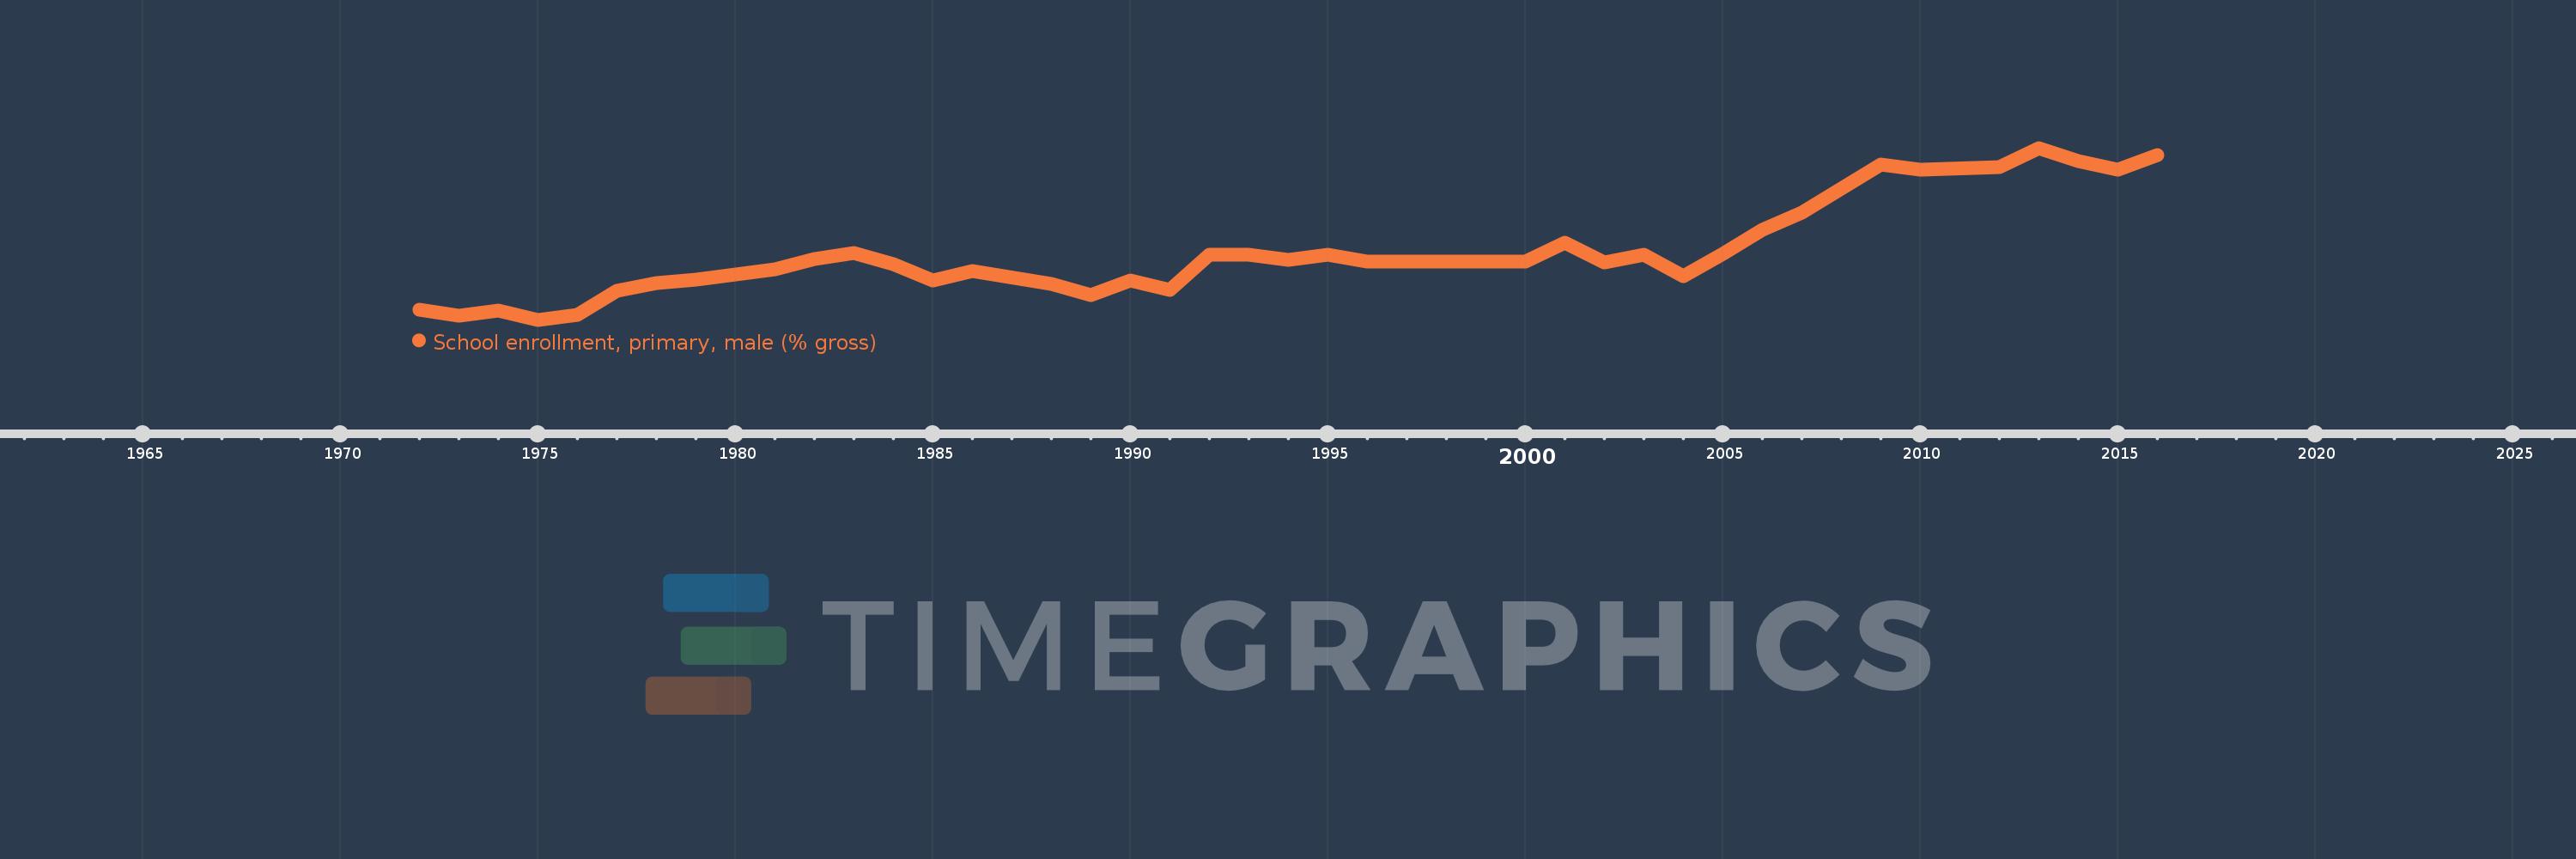
School enrollment, primary, male (% gross)
2016,2015,2014,2013,2012,2010,2009,2008,2007,2006,2005,2004,2003,2002,2001,2000,1996,1995,1994,1993,1992,1991,1990,1989,1988,1986,1985,1984,1983,1982,1981,1980,1979,1978,1977,1976,1975,1974,1973,1972
This statistics in other country:
AfghanistanAlbaniaAlgeriaAndorraAngolaAntigua and BarbudaArab WorldArgentinaArmeniaArubaAustraliaAustriaAzerbaijanBahamas, TheBahrainBangladeshBarbadosBelarusBelgiumBelizeBeninBermudaBhutanBoliviaBosnia and HerzegovinaBotswanaBrazilBrunei DarussalamBulgariaBurkina FasoBurundiCabo VerdeCambodiaCameroonCanadaCaribbean small statesCentral African RepublicCentral Europe and the BalticsChadChileChinaColombiaComorosCongo, Dem. Rep.Congo, Rep.Costa RicaCote d'IvoireCroatiaCubaCuracaoCyprusCzech RepublicDenmarkDjiboutiDominicaDominican RepublicEarly-demographic dividendEast Asia & PacificEast Asia & Pacific (excluding high income)East Asia & Pacific (IDA & IBRD countries)EcuadorEgypt, Arab Rep.El SalvadorEquatorial GuineaEritreaEstoniaEthiopiaEuro areaEurope & Central AsiaEurope & Central Asia (excluding high income)Europe & Central Asia (IDA & IBRD countries)European UnionFijiFinlandFragile and conflict affected situationsFranceGabonGambia, TheGeorgiaGermanyGhanaGreeceGrenadaGuatemalaGuineaGuinea-BissauGuyanaHaitiHeavily indebted poor countries (HIPC)High incomeHondurasHong Kong SAR, ChinaHungaryIBRD onlyIcelandIDA & IBRD totalIDA blendIDA onlyIDA totalIndiaIndonesiaIran, Islamic Rep.IraqIrelandIsraelItalyJamaicaJapanJordanKazakhstanKenyaKiribatiKorea, Dem. People’s Rep.Korea, Rep.KuwaitKyrgyz RepublicLao PDRLate-demographic dividendLatin America & Caribbean Latin America & Caribbean (excluding high income)Latin America & the Caribbean (IDA & IBRD countries)LatviaLeast developed countries: UN classificationLebanonLesothoLiberiaLibyaLiechtensteinLithuaniaLow & middle incomeLow incomeLower middle incomeLuxembourgMacao SAR, ChinaMacedonia, FYRMadagascarMalawiMaldivesMaliMaltaMarshall IslandsMauritaniaMauritiusMexicoMicronesia, Fed. Sts.Middle East & North AfricaMiddle East & North Africa (excluding high income)Middle East & North Africa (IDA & IBRD countries)Middle incomeMoldovaMongoliaMontenegroMoroccoMozambiqueMyanmarNamibiaNauruNepalNetherlandsNew ZealandNicaraguaNigerNigeriaNorth AmericaNorwayOECD membersOmanOther small statesPacific island small statesPakistanPalauPanamaPapua New GuineaParaguayPeruPhilippinesPolandPortugalPost-demographic dividendPre-demographic dividendPuerto RicoQatarRomaniaRussian FederationRwandaSamoaSan MarinoSao Tome and PrincipeSaudi ArabiaSenegalSerbiaSeychellesSierra LeoneSlovak RepublicSloveniaSmall statesSolomon IslandsSomaliaSouth AfricaSouth AsiaSouth Asia (IDA & IBRD)South SudanSpainSri LankaSt. Kitts and NevisSt. LuciaSt. Vincent and the GrenadinesSub-Saharan Africa Sub-Saharan Africa (excluding high income)Sub-Saharan Africa (IDA & IBRD countries)SudanSurinameSwazilandSwedenSwitzerlandSyrian Arab RepublicTajikistanTanzaniaThailandTimor-LesteTogoTongaTrinidad and TobagoTunisiaTurkeyTurkmenistanTuvaluUgandaUkraineUnited Arab EmiratesUnited KingdomUnited StatesUpper middle incomeUruguayUzbekistanVanuatuVenezuela, RBVietnamWest Bank and GazaWorldYemen, Rep.ZambiaZimbabwe Timeline:
This timeline shows a graph from 1972 to 2016 of Ghana. No data until 1971. Number of actual observations by date: 40.
Source name:
World Development Indicators
Source organization:
United Nations Educational, Scientific, and Cultural Organization (UNESCO) Institute for Statistics.
Categories, topics:
Education, Gender
Last updated:
apr 23, 2017
Indicators value changes by year
Maximum:
111.68
jan 1, 2013
At the date of observation
Value
Absolute change
Change from previous value
jan 1, 1972
72.897
+72.897
0.0%
jan 1, 1973
71.489
-1.407
-1.93%
jan 1, 1974
72.761
+1.271
1.78%
jan 1, 1975
70.46
-2.3
-3.16%
jan 1, 1976
71.635
+1.174
1.67%
jan 1, 1977
77.343
+5.708
7.97%
jan 1, 1978
79.254
+1.911
2.47%
jan 1, 1979
80.025
+0.771
0.97%
jan 1, 1980
81.281
+1.256
1.57%
jan 1, 1981
82.595
+1.314
1.62%
jan 1, 1982
84.934
+2.339
2.83%
jan 1, 1983
86.46
+1.526
1.8%
jan 1, 1984
83.87
-2.589
-2.99%
jan 1, 1985
79.956
-3.914
-4.67%
jan 1, 1986
82.052
+2.096
2.62%
jan 1, 1988
79.144
-2.908
-3.54%
jan 1, 1989
76.294
-2.85
-3.6%
jan 1, 1990
79.914
+3.62
4.74%
jan 1, 1991
77.536
-2.378
-2.98%
jan 1, 1992
86.066
+8.531
11.0%
jan 1, 1993
85.986
-0.08
-0.09%
jan 1, 1994
84.803
-1.183
-1.38%
jan 1, 1995
86.112
+1.309
1.54%
jan 1, 1996
84.334
-1.778
-2.06%
jan 1, 2000
84.484
+0.15
0.18%
jan 1, 2001
88.952
+4.468
5.29%
jan 1, 2002
84.247
-4.705
-5.29%
jan 1, 2003
86.135
+1.888
2.24%
jan 1, 2004
80.857
-5.277
-6.13%
jan 1, 2005
86.182
+5.325
6.59%
jan 1, 2006
92.072
+5.89
6.83%
jan 1, 2007
96.177
+4.105
4.46%
jan 1, 2008
101.852
+5.674
5.9%
jan 1, 2009
107.683
+5.831
5.73%
jan 1, 2010
106.504
-1.179
-1.09%
jan 1, 2012
107.134
+0.63
0.59%
jan 1, 2013
111.68
+4.546
4.24%
jan 1, 2014
108.587
-3.093
-2.77%
jan 1, 2015
106.523
-2.064
-1.9%
jan 1, 2016
109.921
+3.398
3.19%
Ranking of countries by current statistics by years


Comments: