29
/
en
AIzaSyAYiBZKx7MnpbEhh9jyipgxe19OcubqV5w
April 1, 2024
32171
Europe & Central Asia (excluding high income)
ECA
false
2
1
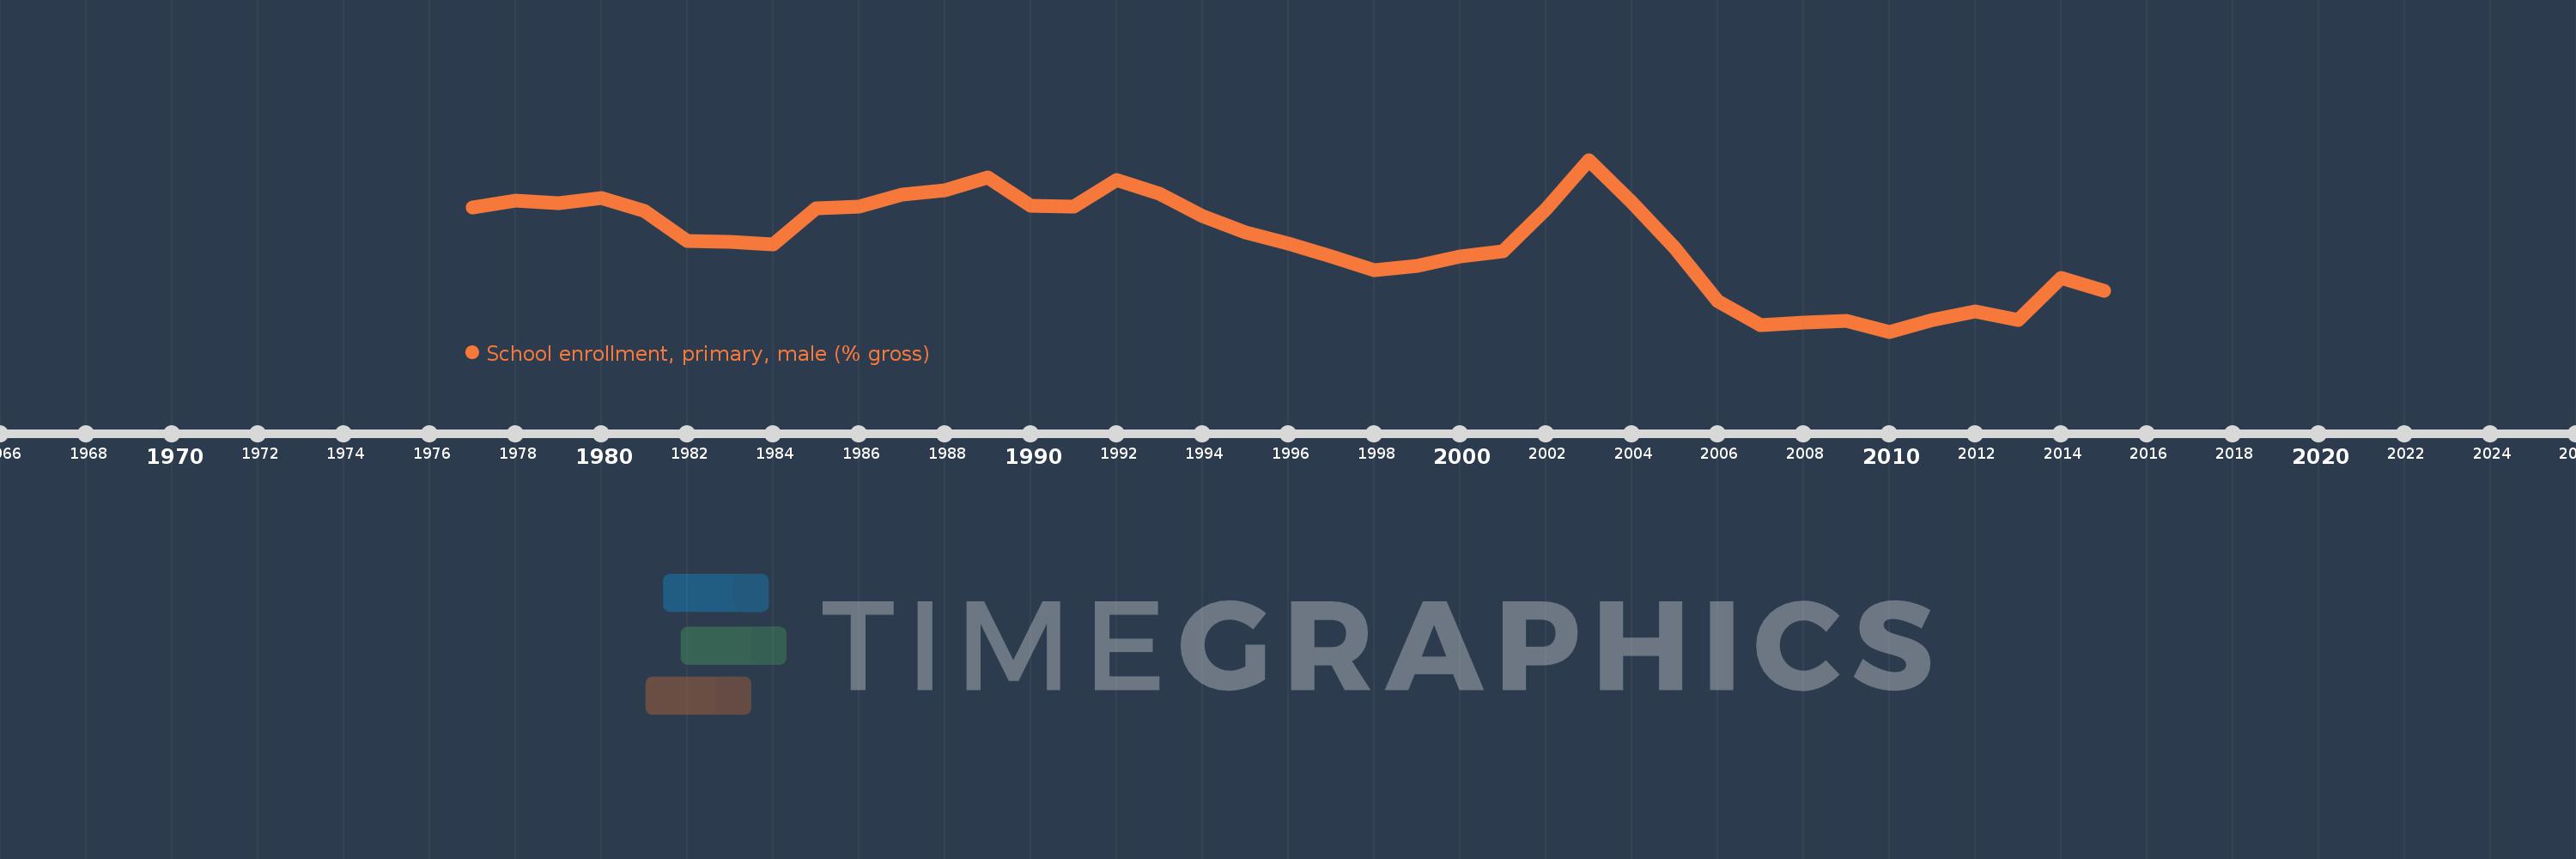
School enrollment, primary, male (% gross)
2015,2014,2013,2012,2011,2010,2009,2008,2007,2006,2005,2004,2003,2002,2001,2000,1999,1998,1997,1996,1995,1994,1993,1992,1991,1990,1989,1988,1987,1986,1985,1984,1983,1982,1981,1980,1979,1978,1977
This statistics in other country:
AfghanistanAlbaniaAlgeriaAndorraAngolaAntigua and BarbudaArab WorldArgentinaArmeniaArubaAustraliaAustriaAzerbaijanBahamas, TheBahrainBangladeshBarbadosBelarusBelgiumBelizeBeninBermudaBhutanBoliviaBosnia and HerzegovinaBotswanaBrazilBrunei DarussalamBulgariaBurkina FasoBurundiCabo VerdeCambodiaCameroonCanadaCaribbean small statesCentral African RepublicCentral Europe and the BalticsChadChileChinaColombiaComorosCongo, Dem. Rep.Congo, Rep.Costa RicaCote d'IvoireCroatiaCubaCuracaoCyprusCzech RepublicDenmarkDjiboutiDominicaDominican RepublicEarly-demographic dividendEast Asia & PacificEast Asia & Pacific (excluding high income)East Asia & Pacific (IDA & IBRD countries)EcuadorEgypt, Arab Rep.El SalvadorEquatorial GuineaEritreaEstoniaEthiopiaEuro areaEurope & Central AsiaEurope & Central Asia (excluding high income)Europe & Central Asia (IDA & IBRD countries)European UnionFijiFinlandFragile and conflict affected situationsFranceGabonGambia, TheGeorgiaGermanyGhanaGreeceGrenadaGuatemalaGuineaGuinea-BissauGuyanaHaitiHeavily indebted poor countries (HIPC)High incomeHondurasHong Kong SAR, ChinaHungaryIBRD onlyIcelandIDA & IBRD totalIDA blendIDA onlyIDA totalIndiaIndonesiaIran, Islamic Rep.IraqIrelandIsraelItalyJamaicaJapanJordanKazakhstanKenyaKiribatiKorea, Dem. People’s Rep.Korea, Rep.KuwaitKyrgyz RepublicLao PDRLate-demographic dividendLatin America & Caribbean Latin America & Caribbean (excluding high income)Latin America & the Caribbean (IDA & IBRD countries)LatviaLeast developed countries: UN classificationLebanonLesothoLiberiaLibyaLiechtensteinLithuaniaLow & middle incomeLow incomeLower middle incomeLuxembourgMacao SAR, ChinaMacedonia, FYRMadagascarMalawiMaldivesMaliMaltaMarshall IslandsMauritaniaMauritiusMexicoMicronesia, Fed. Sts.Middle East & North AfricaMiddle East & North Africa (excluding high income)Middle East & North Africa (IDA & IBRD countries)Middle incomeMoldovaMongoliaMontenegroMoroccoMozambiqueMyanmarNamibiaNauruNepalNetherlandsNew ZealandNicaraguaNigerNigeriaNorth AmericaNorwayOECD membersOmanOther small statesPacific island small statesPakistanPalauPanamaPapua New GuineaParaguayPeruPhilippinesPolandPortugalPost-demographic dividendPre-demographic dividendPuerto RicoQatarRomaniaRussian FederationRwandaSamoaSan MarinoSao Tome and PrincipeSaudi ArabiaSenegalSerbiaSeychellesSierra LeoneSlovak RepublicSloveniaSmall statesSolomon IslandsSomaliaSouth AfricaSouth AsiaSouth Asia (IDA & IBRD)South SudanSpainSri LankaSt. Kitts and NevisSt. LuciaSt. Vincent and the GrenadinesSub-Saharan Africa Sub-Saharan Africa (excluding high income)Sub-Saharan Africa (IDA & IBRD countries)SudanSurinameSwazilandSwedenSwitzerlandSyrian Arab RepublicTajikistanTanzaniaThailandTimor-LesteTogoTongaTrinidad and TobagoTunisiaTurkeyTurkmenistanTuvaluUgandaUkraineUnited Arab EmiratesUnited KingdomUnited StatesUpper middle incomeUruguayUzbekistanVanuatuVenezuela, RBVietnamWest Bank and GazaWorldYemen, Rep.ZambiaZimbabwe Timeline:
This timeline shows a graph from 1977 to 2015 of Europe & Central Asia (excluding high income). No data until 1976. Number of actual observations by date: 39.
Source name:
World Development Indicators
Source organization:
United Nations Educational, Scientific, and Cultural Organization (UNESCO) Institute for Statistics.
Categories, topics:
Education, Gender
Last updated:
apr 23, 2017
Indicators value changes by year
Minimum:
99.901
jan 1, 2010
At the date of observation
Value
Absolute change
Change from previous value
jan 1, 1977
105.961
+105.961
0.0%
jan 1, 1978
106.293
+0.332
0.31%
jan 1, 1979
106.171
-0.122
-0.11%
jan 1, 1980
106.411
+0.239
0.23%
jan 1, 1981
105.792
-0.619
-0.58%
jan 1, 1982
104.334
-1.458
-1.38%
jan 1, 1983
104.277
-0.057
-0.05%
jan 1, 1984
104.175
-0.102
-0.1%
jan 1, 1985
105.924
+1.749
1.68%
jan 1, 1986
106.01
+0.086
0.08%
jan 1, 1987
106.606
+0.595
0.56%
jan 1, 1988
106.814
+0.209
0.2%
jan 1, 1989
107.432
+0.618
0.58%
jan 1, 1990
106.066
-1.366
-1.27%
jan 1, 1991
105.994
-0.072
-0.07%
jan 1, 1992
107.323
+1.329
1.25%
jan 1, 1993
106.648
-0.675
-0.63%
jan 1, 1994
105.551
-1.098
-1.03%
jan 1, 1995
104.744
-0.807
-0.76%
jan 1, 1996
104.222
-0.522
-0.5%
jan 1, 1997
103.596
-0.626
-0.6%
jan 1, 1998
102.918
-0.678
-0.65%
jan 1, 1999
103.131
+0.212
0.21%
jan 1, 2000
103.576
+0.445
0.43%
jan 1, 2001
103.825
+0.249
0.24%
jan 1, 2002
105.902
+2.078
2.0%
jan 1, 2003
108.3
+2.397
2.26%
jan 1, 2004
106.236
-2.064
-1.91%
jan 1, 2005
104.014
-2.222
-2.09%
jan 1, 2006
101.395
-2.618
-2.52%
jan 1, 2007
100.216
-1.18
-1.16%
jan 1, 2008
100.329
+0.114
0.11%
jan 1, 2009
100.405
+0.076
0.08%
jan 1, 2010
99.901
-0.504
-0.5%
jan 1, 2011
100.448
+0.547
0.55%
jan 1, 2012
100.868
+0.42
0.42%
jan 1, 2013
100.469
-0.399
-0.4%
jan 1, 2014
102.507
+2.039
2.03%
jan 1, 2015
101.904
-0.604
-0.59%
Ranking of countries by current statistics by years


Comments: