29
/
en
AIzaSyAYiBZKx7MnpbEhh9jyipgxe19OcubqV5w
April 1, 2024
153056
Hungary
HUN
true
2
1
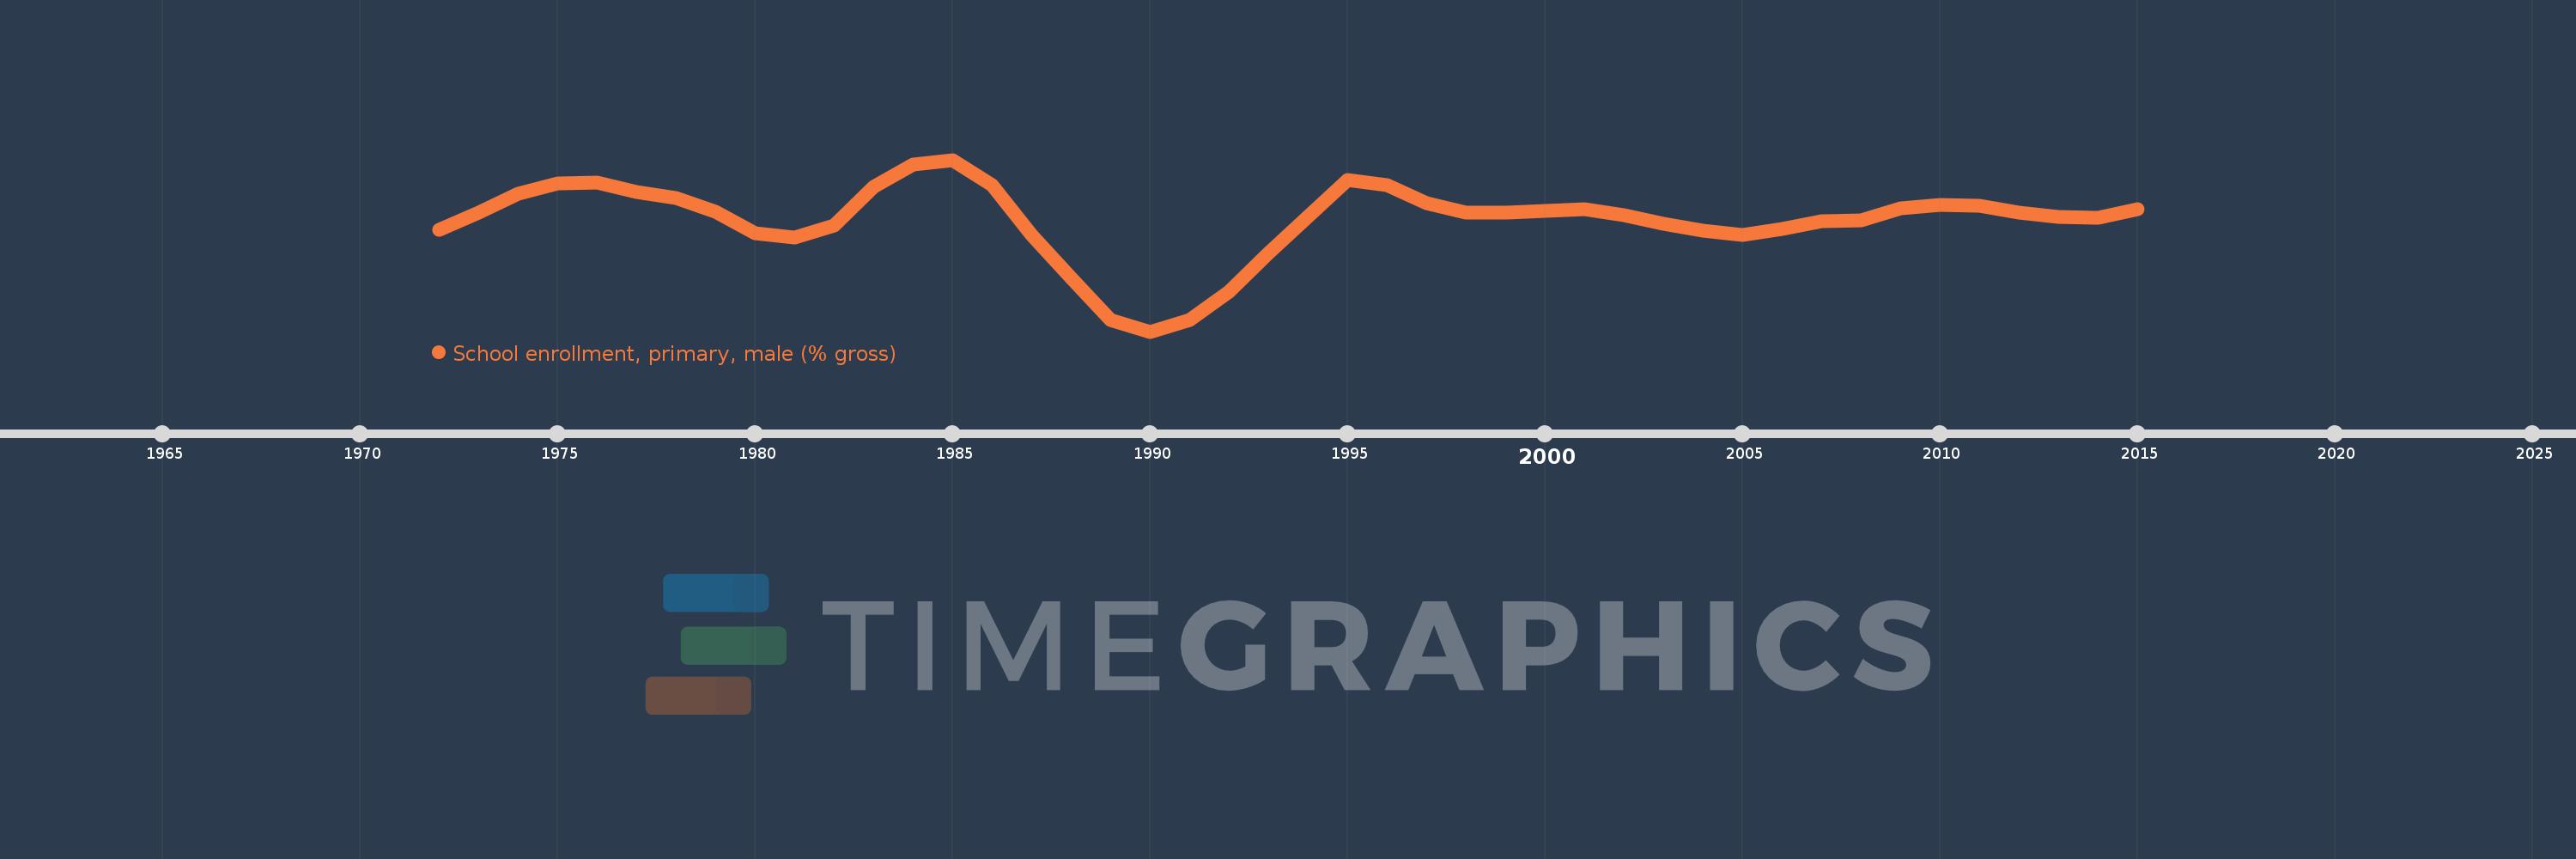
School enrollment, primary, male (% gross)
2015,2014,2013,2012,2011,2010,2009,2008,2007,2006,2005,2004,2003,2002,2001,2000,1999,1998,1997,1996,1995,1993,1992,1991,1990,1989,1988,1987,1986,1985,1984,1983,1982,1981,1980,1979,1978,1977,1976,1975,1974,1973,1972
This statistics in other country:
AfghanistanAlbaniaAlgeriaAndorraAngolaAntigua and BarbudaArab WorldArgentinaArmeniaArubaAustraliaAustriaAzerbaijanBahamas, TheBahrainBangladeshBarbadosBelarusBelgiumBelizeBeninBermudaBhutanBoliviaBosnia and HerzegovinaBotswanaBrazilBrunei DarussalamBulgariaBurkina FasoBurundiCabo VerdeCambodiaCameroonCanadaCaribbean small statesCentral African RepublicCentral Europe and the BalticsChadChileChinaColombiaComorosCongo, Dem. Rep.Congo, Rep.Costa RicaCote d'IvoireCroatiaCubaCuracaoCyprusCzech RepublicDenmarkDjiboutiDominicaDominican RepublicEarly-demographic dividendEast Asia & PacificEast Asia & Pacific (excluding high income)East Asia & Pacific (IDA & IBRD countries)EcuadorEgypt, Arab Rep.El SalvadorEquatorial GuineaEritreaEstoniaEthiopiaEuro areaEurope & Central AsiaEurope & Central Asia (excluding high income)Europe & Central Asia (IDA & IBRD countries)European UnionFijiFinlandFragile and conflict affected situationsFranceGabonGambia, TheGeorgiaGermanyGhanaGreeceGrenadaGuatemalaGuineaGuinea-BissauGuyanaHaitiHeavily indebted poor countries (HIPC)High incomeHondurasHong Kong SAR, ChinaHungaryIBRD onlyIcelandIDA & IBRD totalIDA blendIDA onlyIDA totalIndiaIndonesiaIran, Islamic Rep.IraqIrelandIsraelItalyJamaicaJapanJordanKazakhstanKenyaKiribatiKorea, Dem. People’s Rep.Korea, Rep.KuwaitKyrgyz RepublicLao PDRLate-demographic dividendLatin America & Caribbean Latin America & Caribbean (excluding high income)Latin America & the Caribbean (IDA & IBRD countries)LatviaLeast developed countries: UN classificationLebanonLesothoLiberiaLibyaLiechtensteinLithuaniaLow & middle incomeLow incomeLower middle incomeLuxembourgMacao SAR, ChinaMacedonia, FYRMadagascarMalawiMaldivesMaliMaltaMarshall IslandsMauritaniaMauritiusMexicoMicronesia, Fed. Sts.Middle East & North AfricaMiddle East & North Africa (excluding high income)Middle East & North Africa (IDA & IBRD countries)Middle incomeMoldovaMongoliaMontenegroMoroccoMozambiqueMyanmarNamibiaNauruNepalNetherlandsNew ZealandNicaraguaNigerNigeriaNorth AmericaNorwayOECD membersOmanOther small statesPacific island small statesPakistanPalauPanamaPapua New GuineaParaguayPeruPhilippinesPolandPortugalPost-demographic dividendPre-demographic dividendPuerto RicoQatarRomaniaRussian FederationRwandaSamoaSan MarinoSao Tome and PrincipeSaudi ArabiaSenegalSerbiaSeychellesSierra LeoneSlovak RepublicSloveniaSmall statesSolomon IslandsSomaliaSouth AfricaSouth AsiaSouth Asia (IDA & IBRD)South SudanSpainSri LankaSt. Kitts and NevisSt. LuciaSt. Vincent and the GrenadinesSub-Saharan Africa Sub-Saharan Africa (excluding high income)Sub-Saharan Africa (IDA & IBRD countries)SudanSurinameSwazilandSwedenSwitzerlandSyrian Arab RepublicTajikistanTanzaniaThailandTimor-LesteTogoTongaTrinidad and TobagoTunisiaTurkeyTurkmenistanTuvaluUgandaUkraineUnited Arab EmiratesUnited KingdomUnited StatesUpper middle incomeUruguayUzbekistanVanuatuVenezuela, RBVietnamWest Bank and GazaWorldYemen, Rep.ZambiaZimbabwe Timeline:
This timeline shows a graph from 1972 to 2015 of Hungary. No data until 1971. Number of actual observations by date: 43.
Source name:
World Development Indicators
Source organization:
United Nations Educational, Scientific, and Cultural Organization (UNESCO) Institute for Statistics.
Categories, topics:
Education, Gender
Last updated:
apr 23, 2017
Indicators value changes by year
Minimum:
83.688
jan 1, 1990
Maximum:
109.448
jan 1, 1985
At the date of observation
Value
Absolute change
Change from previous value
jan 1, 1972
98.968
+98.968
0.0%
jan 1, 1973
101.528
+2.56
2.59%
jan 1, 1974
104.377
+2.849
2.81%
jan 1, 1975
105.917
+1.54
1.48%
jan 1, 1976
106.08
+0.163
0.15%
jan 1, 1977
104.664
-1.415
-1.33%
jan 1, 1978
103.727
-0.938
-0.9%
jan 1, 1979
101.654
-2.072
-2.0%
jan 1, 1980
98.491
-3.164
-3.11%
jan 1, 1981
97.75
-0.74
-0.75%
jan 1, 1982
99.548
+1.797
1.84%
jan 1, 1983
105.425
+5.878
5.9%
jan 1, 1984
108.748
+3.323
3.15%
jan 1, 1985
109.448
+0.7
0.64%
jan 1, 1986
105.695
-3.753
-3.43%
jan 1, 1987
98.189
-7.506
-7.1%
jan 1, 1988
91.693
-6.496
-6.62%
jan 1, 1989
85.395
-6.298
-6.87%
jan 1, 1990
83.688
-1.707
-2.0%
jan 1, 1991
85.441
+1.753
2.09%
jan 1, 1992
89.676
+4.235
4.96%
jan 1, 1993
95.498
+5.822
6.49%
jan 1, 1995
106.475
+10.977
11.49%
jan 1, 1996
105.671
-0.804
-0.76%
jan 1, 1997
102.987
-2.684
-2.54%
jan 1, 1998
101.535
-1.452
-1.41%
jan 1, 1999
101.514
-0.021
-0.02%
jan 1, 2000
101.76
+0.246
0.24%
jan 1, 2001
102.071
+0.311
0.31%
jan 1, 2002
101.131
-0.94
-0.92%
jan 1, 2003
99.888
-1.243
-1.23%
jan 1, 2004
98.865
-1.023
-1.02%
jan 1, 2005
98.227
-0.638
-0.64%
jan 1, 2006
99.057
+0.83
0.84%
jan 1, 2007
100.24
+1.183
1.19%
jan 1, 2008
100.358
+0.118
0.12%
jan 1, 2009
102.213
+1.855
1.85%
jan 1, 2010
102.7
+0.487
0.48%
jan 1, 2011
102.561
-0.14
-0.14%
jan 1, 2012
101.535
-1.025
-1.0%
jan 1, 2013
100.828
-0.707
-0.7%
jan 1, 2014
100.711
-0.116
-0.12%
jan 1, 2015
102.078
+1.367
1.36%
Ranking of countries by current statistics by years


Comments: