30
/
AIzaSyAYiBZKx7MnpbEhh9jyipgxe19OcubqV5w
April 1, 2024
158940
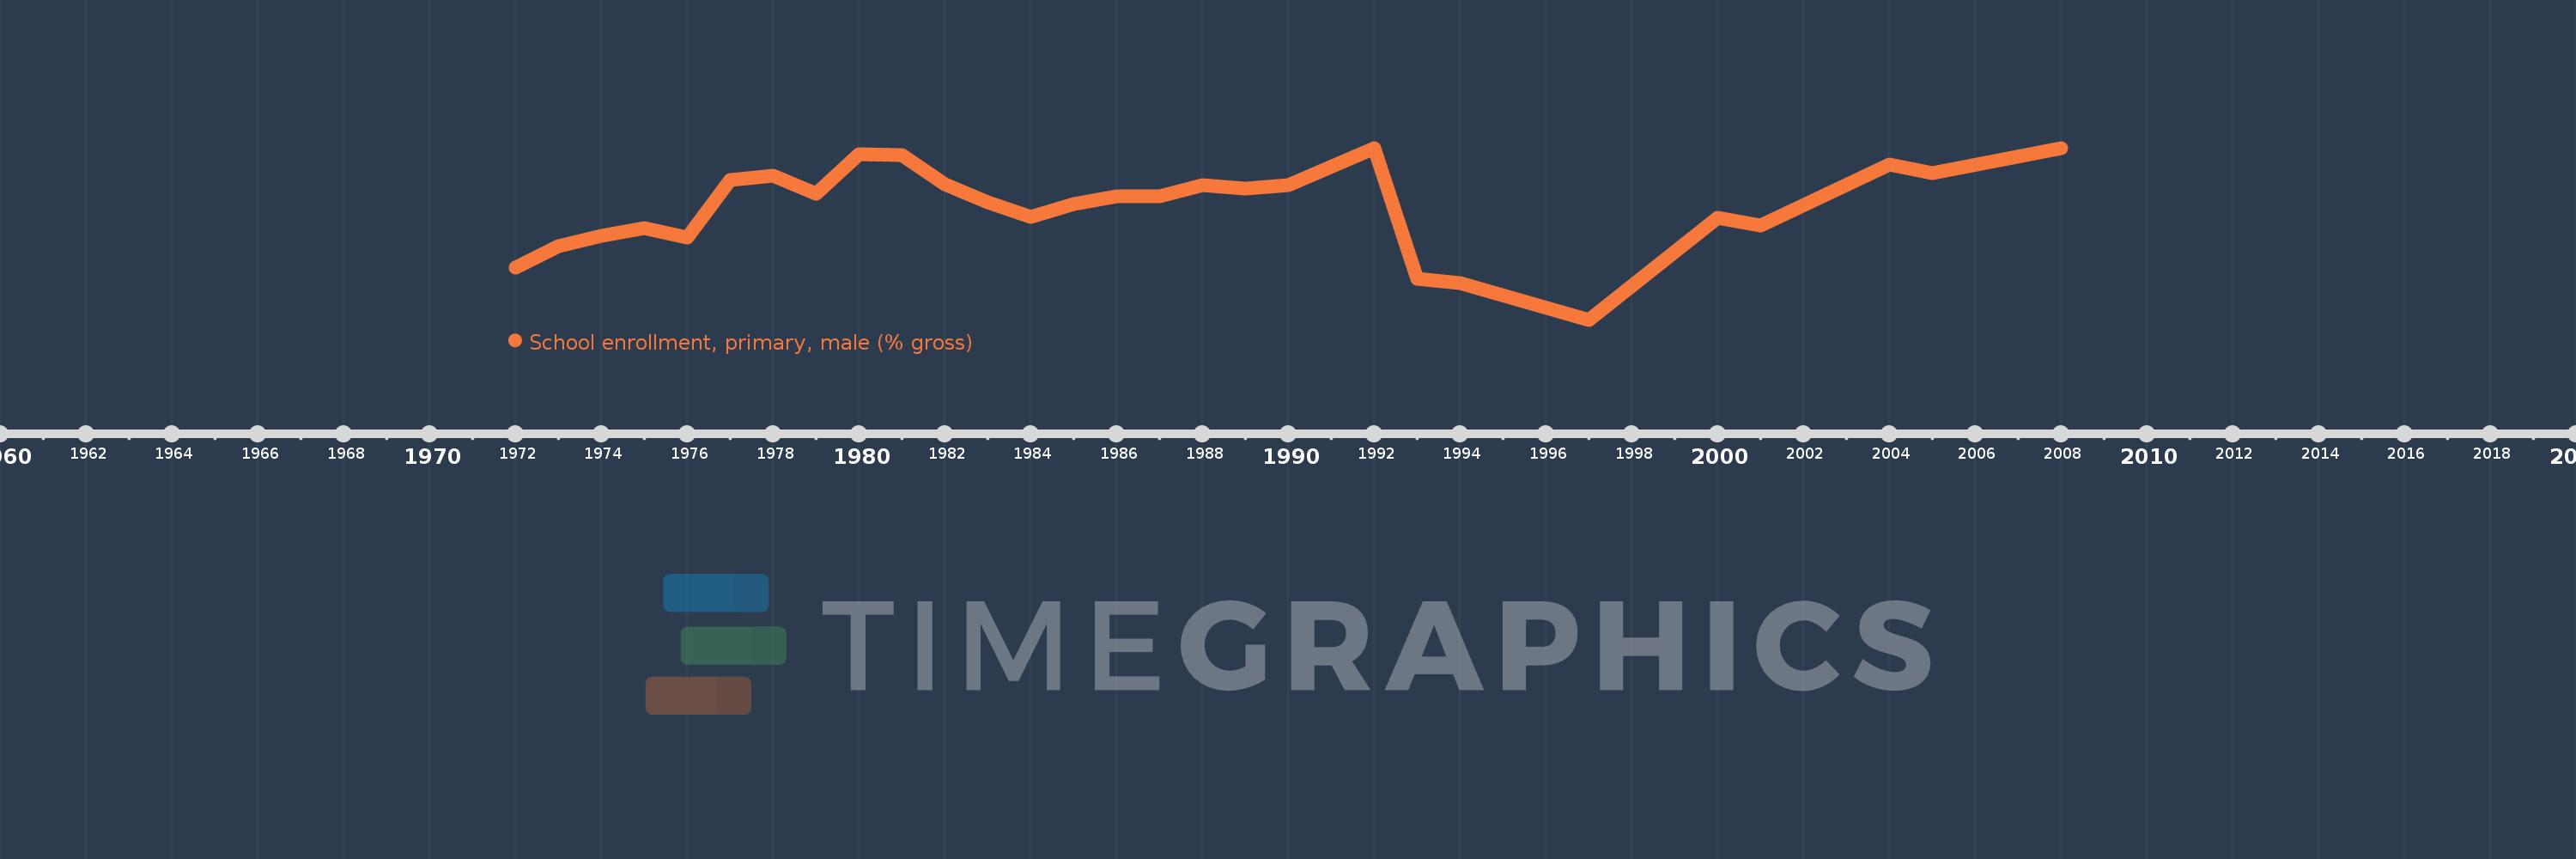
Iraq
IRQ
true
2
1
School enrollment, primary, male (% gross)
2008,2005,2004,2001,2000,1997,1994,1993,1992,1990,1989,1988,1987,1986,1985,1984,1983,1982,1981,1980,1979,1978,1977,1976,1975,1974,1973,1972
