29
/
en
AIzaSyAYiBZKx7MnpbEhh9jyipgxe19OcubqV5w
April 1, 2024
53021
OECD members
OED
false
2
1
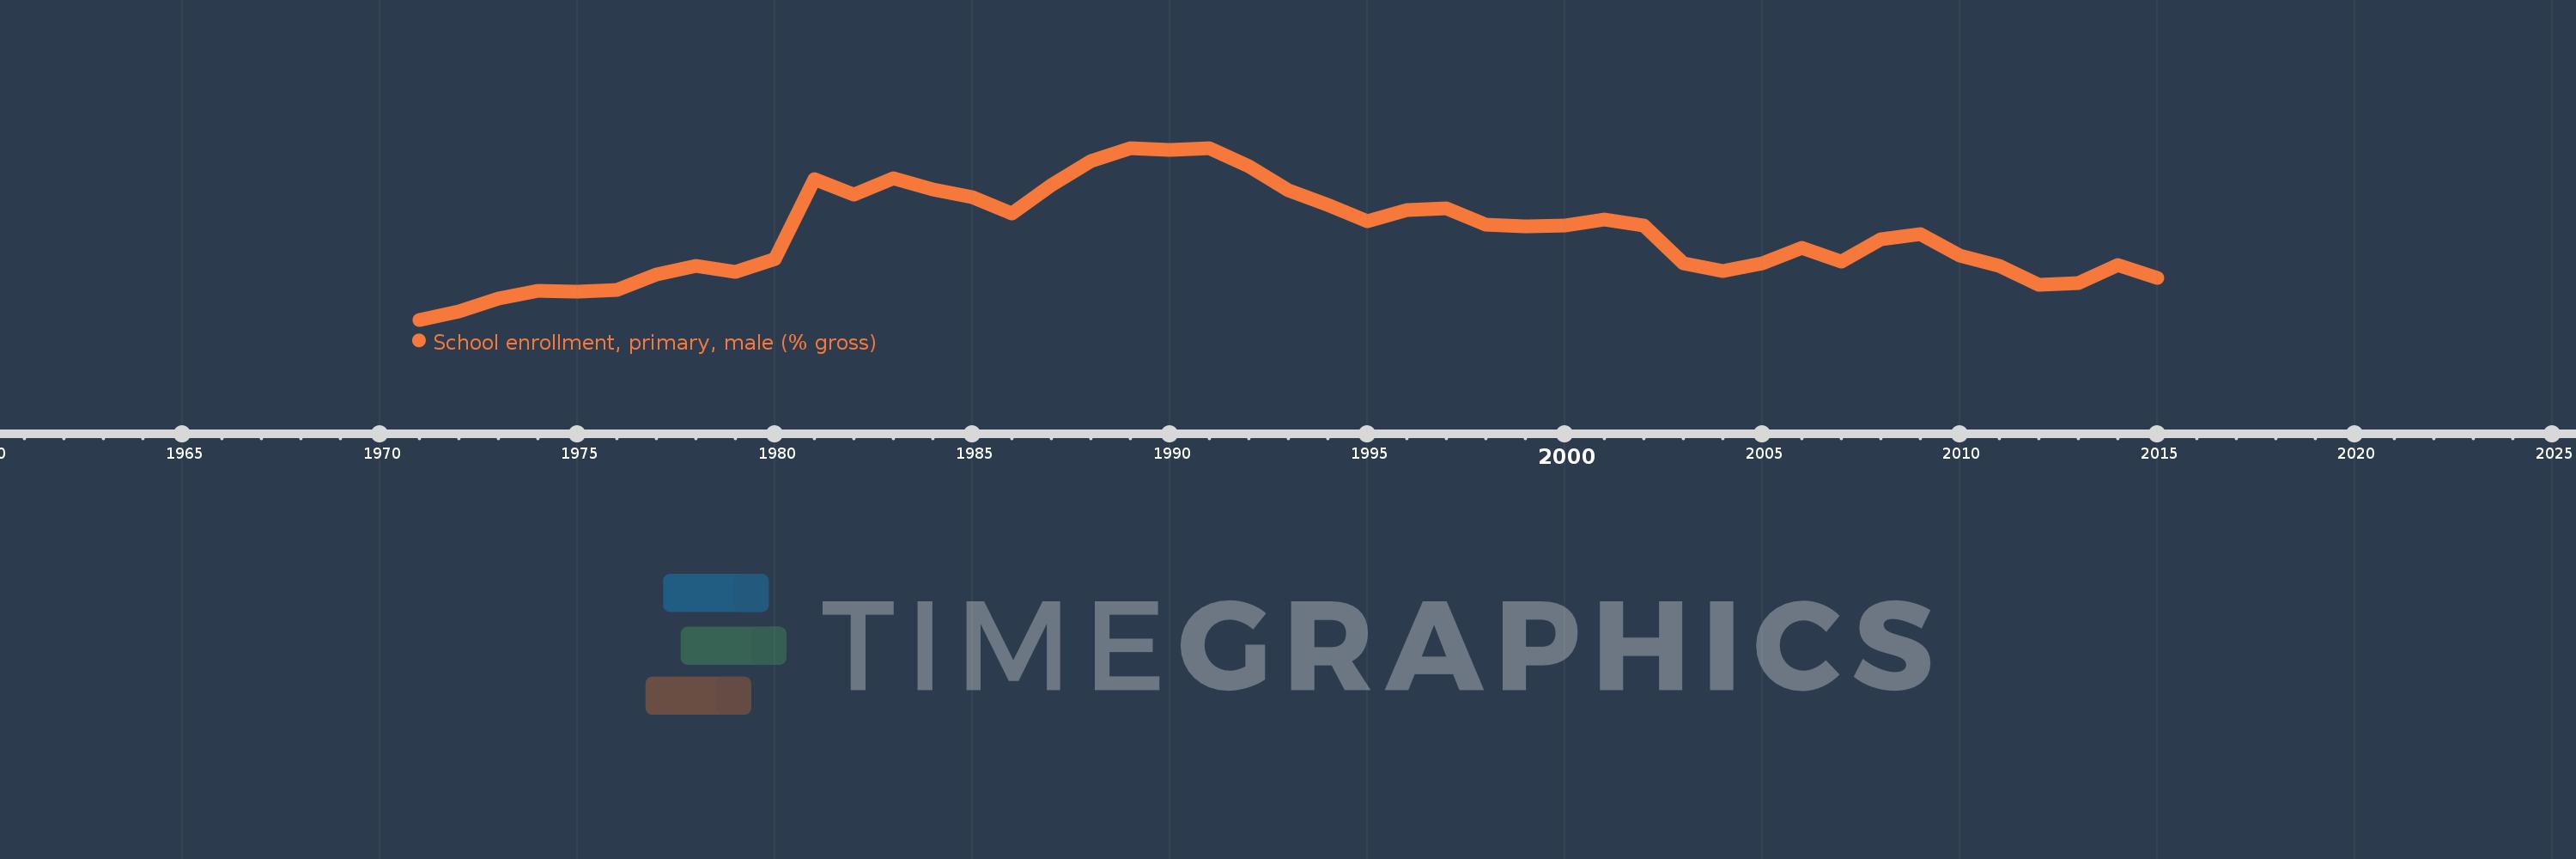
School enrollment, primary, male (% gross)
2015,2014,2013,2012,2011,2010,2009,2008,2007,2006,2005,2004,2003,2002,2001,2000,1999,1998,1997,1996,1995,1994,1993,1992,1991,1990,1989,1988,1987,1986,1985,1984,1983,1982,1981,1980,1979,1978,1977,1976,1975,1974,1973,1972,1971
This statistics in other country:
AfghanistanAlbaniaAlgeriaAndorraAngolaAntigua and BarbudaArab WorldArgentinaArmeniaArubaAustraliaAustriaAzerbaijanBahamas, TheBahrainBangladeshBarbadosBelarusBelgiumBelizeBeninBermudaBhutanBoliviaBosnia and HerzegovinaBotswanaBrazilBrunei DarussalamBulgariaBurkina FasoBurundiCabo VerdeCambodiaCameroonCanadaCaribbean small statesCentral African RepublicCentral Europe and the BalticsChadChileChinaColombiaComorosCongo, Dem. Rep.Congo, Rep.Costa RicaCote d'IvoireCroatiaCubaCuracaoCyprusCzech RepublicDenmarkDjiboutiDominicaDominican RepublicEarly-demographic dividendEast Asia & PacificEast Asia & Pacific (excluding high income)East Asia & Pacific (IDA & IBRD countries)EcuadorEgypt, Arab Rep.El SalvadorEquatorial GuineaEritreaEstoniaEthiopiaEuro areaEurope & Central AsiaEurope & Central Asia (excluding high income)Europe & Central Asia (IDA & IBRD countries)European UnionFijiFinlandFragile and conflict affected situationsFranceGabonGambia, TheGeorgiaGermanyGhanaGreeceGrenadaGuatemalaGuineaGuinea-BissauGuyanaHaitiHeavily indebted poor countries (HIPC)High incomeHondurasHong Kong SAR, ChinaHungaryIBRD onlyIcelandIDA & IBRD totalIDA blendIDA onlyIDA totalIndiaIndonesiaIran, Islamic Rep.IraqIrelandIsraelItalyJamaicaJapanJordanKazakhstanKenyaKiribatiKorea, Dem. People’s Rep.Korea, Rep.KuwaitKyrgyz RepublicLao PDRLate-demographic dividendLatin America & Caribbean Latin America & Caribbean (excluding high income)Latin America & the Caribbean (IDA & IBRD countries)LatviaLeast developed countries: UN classificationLebanonLesothoLiberiaLibyaLiechtensteinLithuaniaLow & middle incomeLow incomeLower middle incomeLuxembourgMacao SAR, ChinaMacedonia, FYRMadagascarMalawiMaldivesMaliMaltaMarshall IslandsMauritaniaMauritiusMexicoMicronesia, Fed. Sts.Middle East & North AfricaMiddle East & North Africa (excluding high income)Middle East & North Africa (IDA & IBRD countries)Middle incomeMoldovaMongoliaMontenegroMoroccoMozambiqueMyanmarNamibiaNauruNepalNetherlandsNew ZealandNicaraguaNigerNigeriaNorth AmericaNorwayOECD membersOmanOther small statesPacific island small statesPakistanPalauPanamaPapua New GuineaParaguayPeruPhilippinesPolandPortugalPost-demographic dividendPre-demographic dividendPuerto RicoQatarRomaniaRussian FederationRwandaSamoaSan MarinoSao Tome and PrincipeSaudi ArabiaSenegalSerbiaSeychellesSierra LeoneSlovak RepublicSloveniaSmall statesSolomon IslandsSomaliaSouth AfricaSouth AsiaSouth Asia (IDA & IBRD)South SudanSpainSri LankaSt. Kitts and NevisSt. LuciaSt. Vincent and the GrenadinesSub-Saharan Africa Sub-Saharan Africa (excluding high income)Sub-Saharan Africa (IDA & IBRD countries)SudanSurinameSwazilandSwedenSwitzerlandSyrian Arab RepublicTajikistanTanzaniaThailandTimor-LesteTogoTongaTrinidad and TobagoTunisiaTurkeyTurkmenistanTuvaluUgandaUkraineUnited Arab EmiratesUnited KingdomUnited StatesUpper middle incomeUruguayUzbekistanVanuatuVenezuela, RBVietnamWest Bank and GazaWorldYemen, Rep.ZambiaZimbabwe Timeline:
This timeline shows a graph from 1971 to 2015 of OECD members. No data until 1970. Number of actual observations by date: 45.
Source name:
World Development Indicators
Source organization:
United Nations Educational, Scientific, and Cultural Organization (UNESCO) Institute for Statistics.
Categories, topics:
Education, Gender
Last updated:
apr 23, 2017
Indicators value changes by year
Minimum:
101.796
jan 1, 1971
Maximum:
105.516
jan 1, 1991
At the date of observation
Value
Absolute change
Change from previous value
jan 1, 1971
101.796
+101.796
0.0%
jan 1, 1972
101.984
+0.188
0.18%
jan 1, 1973
102.259
+0.275
0.27%
jan 1, 1974
102.427
+0.168
0.16%
jan 1, 1975
102.406
-0.022
-0.02%
jan 1, 1976
102.448
+0.042
0.04%
jan 1, 1977
102.777
+0.33
0.32%
jan 1, 1978
102.955
+0.177
0.17%
jan 1, 1979
102.838
-0.117
-0.11%
jan 1, 1980
103.113
+0.275
0.27%
jan 1, 1981
104.833
+1.72
1.67%
jan 1, 1982
104.499
-0.334
-0.32%
jan 1, 1983
104.861
+0.363
0.35%
jan 1, 1984
104.609
-0.252
-0.24%
jan 1, 1985
104.443
-0.166
-0.16%
jan 1, 1986
104.095
-0.347
-0.33%
jan 1, 1987
104.704
+0.609
0.58%
jan 1, 1988
105.225
+0.521
0.5%
jan 1, 1989
105.511
+0.286
0.27%
jan 1, 1990
105.479
-0.033
-0.03%
jan 1, 1991
105.516
+0.037
0.04%
jan 1, 1992
105.126
-0.389
-0.37%
jan 1, 1993
104.6
-0.526
-0.5%
jan 1, 1994
104.281
-0.319
-0.3%
jan 1, 1995
103.937
-0.344
-0.33%
jan 1, 1996
104.173
+0.236
0.23%
jan 1, 1997
104.216
+0.043
0.04%
jan 1, 1998
103.851
-0.365
-0.35%
jan 1, 1999
103.815
-0.035
-0.03%
jan 1, 2000
103.836
+0.021
0.02%
jan 1, 2001
103.97
+0.134
0.13%
jan 1, 2002
103.84
-0.13
-0.13%
jan 1, 2003
103.011
-0.829
-0.8%
jan 1, 2004
102.858
-0.153
-0.15%
jan 1, 2005
103.021
+0.163
0.16%
jan 1, 2006
103.357
+0.336
0.33%
jan 1, 2007
103.056
-0.301
-0.29%
jan 1, 2008
103.544
+0.488
0.47%
jan 1, 2009
103.652
+0.108
0.1%
jan 1, 2010
103.186
-0.466
-0.45%
jan 1, 2011
102.97
-0.216
-0.21%
jan 1, 2012
102.553
-0.416
-0.4%
jan 1, 2013
102.599
+0.046
0.04%
jan 1, 2014
102.982
+0.383
0.37%
jan 1, 2015
102.708
-0.274
-0.27%
Ranking of countries by current statistics by years


Comments: