29
/
en
AIzaSyAYiBZKx7MnpbEhh9jyipgxe19OcubqV5w
April 1, 2024
232775
Samoa
WSM
true
2
1
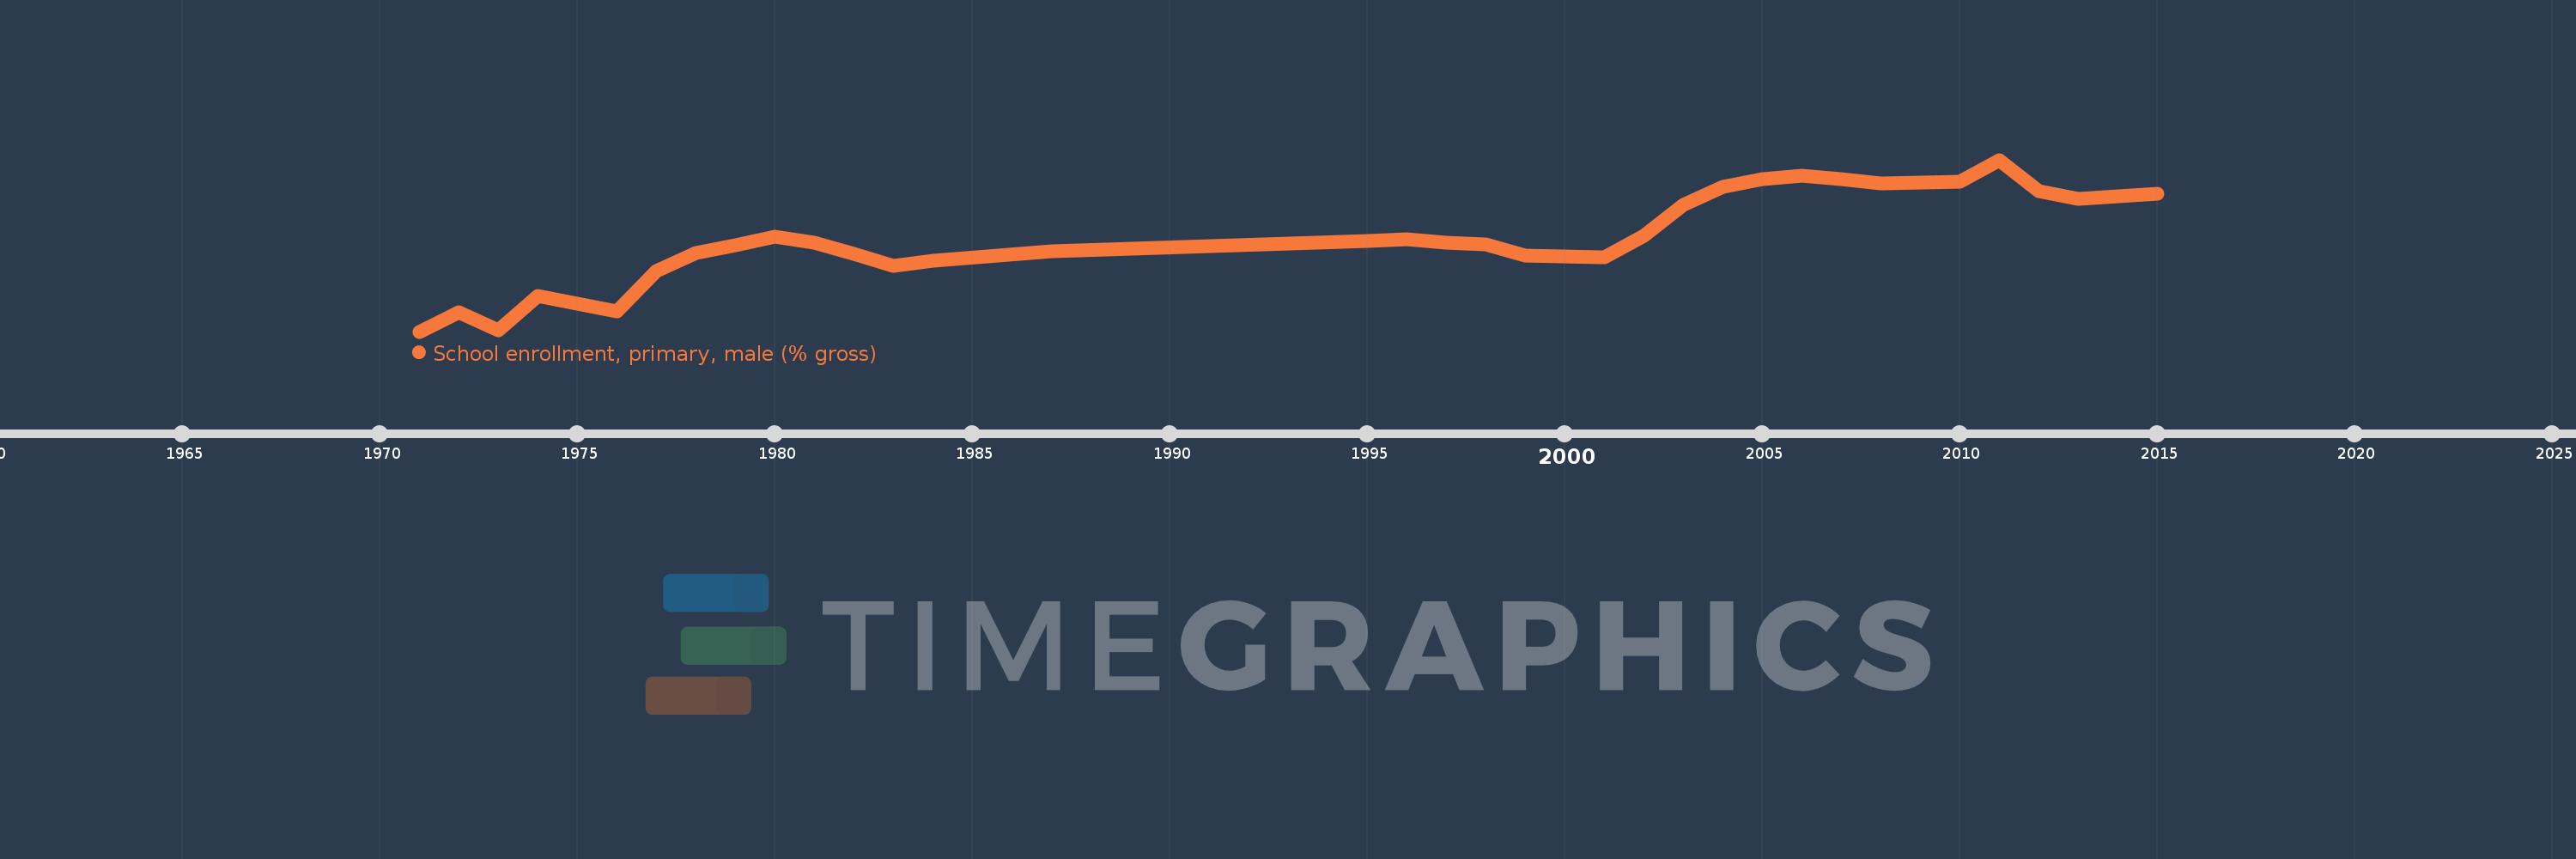
School enrollment, primary, male (% gross)
2015,2013,2012,2011,2010,2008,2007,2006,2005,2004,2003,2002,2001,2000,1999,1998,1997,1996,1995,1987,1984,1983,1982,1981,1980,1979,1978,1977,1976,1974,1973,1972,1971
This statistics in other country:
AfghanistanAlbaniaAlgeriaAndorraAngolaAntigua and BarbudaArab WorldArgentinaArmeniaArubaAustraliaAustriaAzerbaijanBahamas, TheBahrainBangladeshBarbadosBelarusBelgiumBelizeBeninBermudaBhutanBoliviaBosnia and HerzegovinaBotswanaBrazilBrunei DarussalamBulgariaBurkina FasoBurundiCabo VerdeCambodiaCameroonCanadaCaribbean small statesCentral African RepublicCentral Europe and the BalticsChadChileChinaColombiaComorosCongo, Dem. Rep.Congo, Rep.Costa RicaCote d'IvoireCroatiaCubaCuracaoCyprusCzech RepublicDenmarkDjiboutiDominicaDominican RepublicEarly-demographic dividendEast Asia & PacificEast Asia & Pacific (excluding high income)East Asia & Pacific (IDA & IBRD countries)EcuadorEgypt, Arab Rep.El SalvadorEquatorial GuineaEritreaEstoniaEthiopiaEuro areaEurope & Central AsiaEurope & Central Asia (excluding high income)Europe & Central Asia (IDA & IBRD countries)European UnionFijiFinlandFragile and conflict affected situationsFranceGabonGambia, TheGeorgiaGermanyGhanaGreeceGrenadaGuatemalaGuineaGuinea-BissauGuyanaHaitiHeavily indebted poor countries (HIPC)High incomeHondurasHong Kong SAR, ChinaHungaryIBRD onlyIcelandIDA & IBRD totalIDA blendIDA onlyIDA totalIndiaIndonesiaIran, Islamic Rep.IraqIrelandIsraelItalyJamaicaJapanJordanKazakhstanKenyaKiribatiKorea, Dem. People’s Rep.Korea, Rep.KuwaitKyrgyz RepublicLao PDRLate-demographic dividendLatin America & Caribbean Latin America & Caribbean (excluding high income)Latin America & the Caribbean (IDA & IBRD countries)LatviaLeast developed countries: UN classificationLebanonLesothoLiberiaLibyaLiechtensteinLithuaniaLow & middle incomeLow incomeLower middle incomeLuxembourgMacao SAR, ChinaMacedonia, FYRMadagascarMalawiMaldivesMaliMaltaMarshall IslandsMauritaniaMauritiusMexicoMicronesia, Fed. Sts.Middle East & North AfricaMiddle East & North Africa (excluding high income)Middle East & North Africa (IDA & IBRD countries)Middle incomeMoldovaMongoliaMontenegroMoroccoMozambiqueMyanmarNamibiaNauruNepalNetherlandsNew ZealandNicaraguaNigerNigeriaNorth AmericaNorwayOECD membersOmanOther small statesPacific island small statesPakistanPalauPanamaPapua New GuineaParaguayPeruPhilippinesPolandPortugalPost-demographic dividendPre-demographic dividendPuerto RicoQatarRomaniaRussian FederationRwandaSamoaSan MarinoSao Tome and PrincipeSaudi ArabiaSenegalSerbiaSeychellesSierra LeoneSlovak RepublicSloveniaSmall statesSolomon IslandsSomaliaSouth AfricaSouth AsiaSouth Asia (IDA & IBRD)South SudanSpainSri LankaSt. Kitts and NevisSt. LuciaSt. Vincent and the GrenadinesSub-Saharan Africa Sub-Saharan Africa (excluding high income)Sub-Saharan Africa (IDA & IBRD countries)SudanSurinameSwazilandSwedenSwitzerlandSyrian Arab RepublicTajikistanTanzaniaThailandTimor-LesteTogoTongaTrinidad and TobagoTunisiaTurkeyTurkmenistanTuvaluUgandaUkraineUnited Arab EmiratesUnited KingdomUnited StatesUpper middle incomeUruguayUzbekistanVanuatuVenezuela, RBVietnamWest Bank and GazaWorldYemen, Rep.ZambiaZimbabwe Timeline:
This timeline shows a graph from 1971 to 2015 of Samoa. No data until 1970. Number of actual observations by date: 33.
Source name:
World Development Indicators
Source organization:
United Nations Educational, Scientific, and Cultural Organization (UNESCO) Institute for Statistics.
Categories, topics:
Education, Gender
Last updated:
apr 23, 2017
Indicators value changes by year
Minimum:
84.039
jan 1, 1971
Maximum:
111.516
jan 1, 2011
At the date of observation
Value
Absolute change
Change from previous value
jan 1, 1971
84.039
+84.039
0.0%
jan 1, 1972
87.181
+3.142
3.74%
jan 1, 1973
84.313
-2.868
-3.29%
jan 1, 1974
89.697
+5.384
6.39%
jan 1, 1976
87.219
-2.478
-2.76%
jan 1, 1977
93.761
+6.542
7.5%
jan 1, 1978
96.564
+2.803
2.99%
jan 1, 1979
97.857
+1.293
1.34%
jan 1, 1980
99.209
+1.352
1.38%
jan 1, 1981
98.302
-0.908
-0.91%
jan 1, 1982
96.49
-1.812
-1.84%
jan 1, 1983
94.489
-2.0
-2.07%
jan 1, 1984
95.31
+0.821
0.87%
jan 1, 1987
96.817
+1.507
1.58%
jan 1, 1995
98.505
+1.688
1.74%
jan 1, 1996
98.795
+0.29
0.29%
jan 1, 1997
98.237
-0.557
-0.56%
jan 1, 1998
98.002
-0.235
-0.24%
jan 1, 1999
96.246
-1.756
-1.79%
jan 1, 2000
96.093
-0.153
-0.16%
jan 1, 2001
95.893
-0.2
-0.21%
jan 1, 2002
99.416
+3.523
3.67%
jan 1, 2003
104.362
+4.946
4.98%
jan 1, 2004
107.143
+2.781
2.66%
jan 1, 2005
108.45
+1.307
1.22%
jan 1, 2006
108.997
+0.547
0.5%
jan 1, 2007
108.464
-0.533
-0.49%
jan 1, 2008
107.733
-0.73
-0.67%
jan 1, 2010
107.991
+0.257
0.24%
jan 1, 2011
111.516
+3.525
3.26%
jan 1, 2012
106.492
-5.023
-4.5%
jan 1, 2013
105.277
-1.215
-1.14%
jan 1, 2015
106.061
+0.784
0.74%
Ranking of countries by current statistics by years


Comments: