29
/
en
AIzaSyAYiBZKx7MnpbEhh9jyipgxe19OcubqV5w
April 1, 2024
42274
Latin America & Caribbean (excluding high income)
LAC
false
2
1
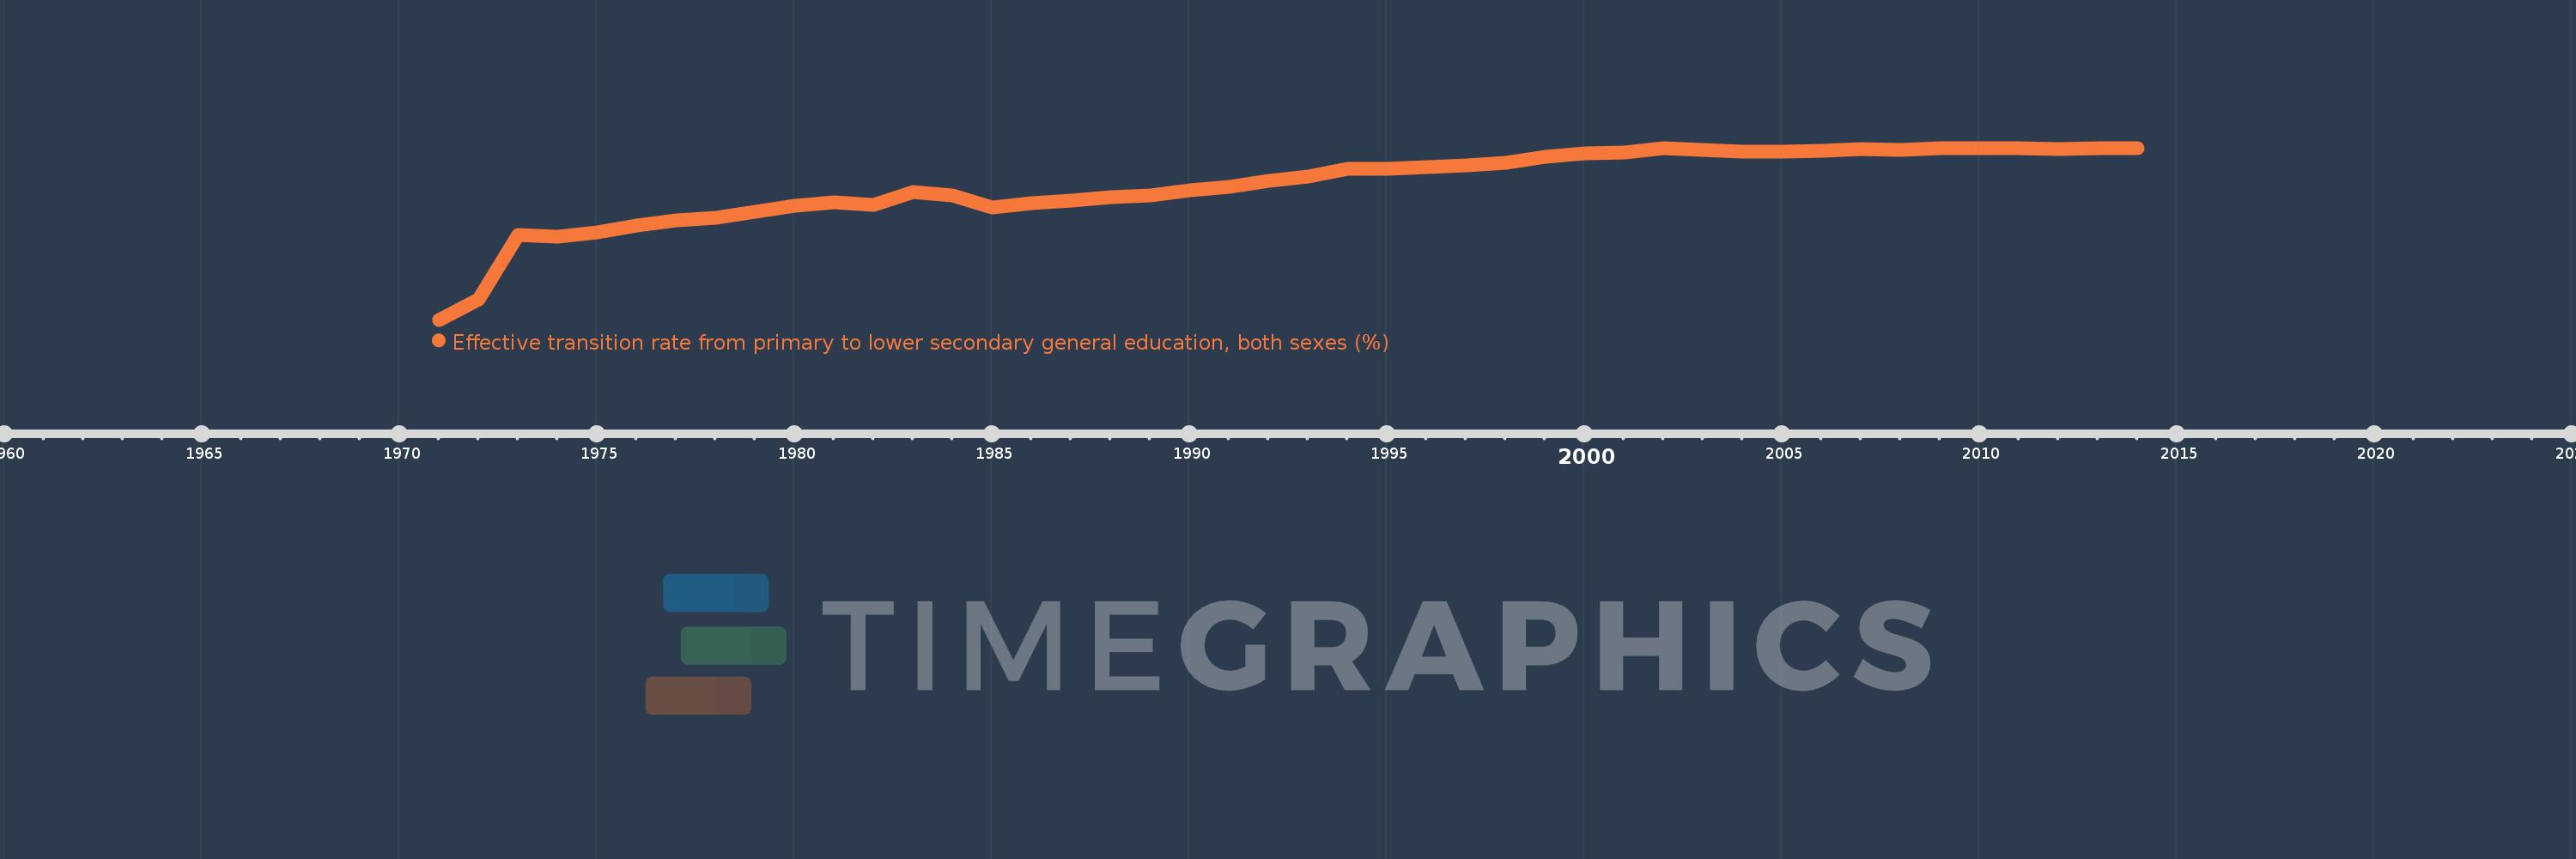
Effective transition rate from primary to lower secondary general education, both sexes (%)
2014,2013,2012,2011,2010,2009,2008,2007,2006,2005,2004,2003,2002,2001,2000,1999,1998,1997,1996,1995,1994,1993,1992,1991,1990,1989,1988,1987,1986,1985,1984,1983,1982,1981,1980,1979,1978,1977,1976,1975,1974,1973,1972,1971
This statistics in other country:
AfghanistanAlbaniaAlgeriaAngolaAntigua and BarbudaArab WorldArgentinaArmeniaArubaAustriaAzerbaijanBahamas, TheBahrainBangladeshBarbadosBelarusBelgiumBelizeBeninBermudaBhutanBoliviaBosnia and HerzegovinaBotswanaBrazilBritish Virgin IslandsBrunei DarussalamBulgariaBurkina FasoBurundiCabo VerdeCambodiaCameroonCaribbean small statesCayman IslandsCentral African RepublicCentral Europe and the BalticsChadChileChinaColombiaComorosCongo, Dem. Rep.Congo, Rep.Costa RicaCote d'IvoireCroatiaCubaCyprusCzech RepublicDenmarkDjiboutiDominicaDominican RepublicEarly-demographic dividendEast Asia & PacificEast Asia & Pacific (excluding high income)East Asia & Pacific (IDA & IBRD countries)EcuadorEgypt, Arab Rep.El SalvadorEquatorial GuineaEritreaEstoniaEthiopiaEuro areaEurope & Central AsiaEurope & Central Asia (excluding high income)Europe & Central Asia (IDA & IBRD countries)European UnionFijiFinlandFragile and conflict affected situationsFranceGabonGambia, TheGeorgiaGermanyGhanaGreeceGrenadaGuatemalaGuineaGuinea-BissauGuyanaHaitiHeavily indebted poor countries (HIPC)High incomeHondurasHong Kong SAR, ChinaHungaryIBRD onlyIcelandIDA & IBRD totalIDA blendIDA onlyIDA totalIndiaIndonesiaIran, Islamic Rep.IraqIsraelItalyJamaicaJapanJordanKazakhstanKenyaKiribatiKorea, Rep.KuwaitKyrgyz RepublicLao PDRLate-demographic dividendLatin America & Caribbean Latin America & Caribbean (excluding high income)Latin America & the Caribbean (IDA & IBRD countries)LatviaLeast developed countries: UN classificationLebanonLesothoLiberiaLibyaLiechtensteinLithuaniaLow & middle incomeLow incomeLower middle incomeLuxembourgMacao SAR, ChinaMacedonia, FYRMadagascarMalawiMalaysiaMaldivesMaliMaltaMarshall IslandsMauritaniaMauritiusMexicoMiddle East & North AfricaMiddle East & North Africa (excluding high income)Middle East & North Africa (IDA & IBRD countries)Middle incomeMoldovaMonacoMongoliaMoroccoMozambiqueMyanmarNamibiaNepalNetherlandsNicaraguaNigerNorwayOECD membersOmanOther small statesPacific island small statesPakistanPalauPanamaParaguayPeruPhilippinesPolandPortugalPost-demographic dividendPre-demographic dividendQatarRomaniaRussian FederationRwandaSamoaSan MarinoSao Tome and PrincipeSaudi ArabiaSenegalSerbiaSeychellesSierra LeoneSingaporeSlovak RepublicSloveniaSmall statesSolomon IslandsSouth AfricaSouth AsiaSouth Asia (IDA & IBRD)SpainSri LankaSt. Kitts and NevisSt. LuciaSt. Vincent and the GrenadinesSub-Saharan Africa Sub-Saharan Africa (excluding high income)Sub-Saharan Africa (IDA & IBRD countries)SudanSurinameSwazilandSwedenSwitzerlandSyrian Arab RepublicTajikistanTanzaniaThailandTimor-LesteTogoTongaTrinidad and TobagoTunisiaTurkeyTurks and Caicos IslandsTuvaluUgandaUkraineUnited Arab EmiratesUpper middle incomeUruguayUzbekistanVanuatuVenezuela, RBVietnamWest Bank and GazaWorldYemen, Rep.ZambiaZimbabwe Timeline:
This timeline shows a graph from 1971 to 2014 of Latin America & Caribbean (excluding high income). No data until 1970. Number of actual observations by date: 44.
Source name:
World Development Indicators
Source organization:
UNESCO Institute for Statistics
Categories, topics:
Education
Last updated:
apr 23, 2017
Indicators value changes by year
Minimum:
53.625
jan 1, 1971
Maximum:
95.078
jan 1, 2009
At the date of observation
Value
Absolute change
Change from previous value
jan 1, 1971
53.625
+53.625
0.0%
jan 1, 1972
58.436
+4.811
8.97%
jan 1, 1973
74.016
+15.58
26.66%
jan 1, 1974
73.642
-0.374
-0.51%
jan 1, 1975
74.649
+1.007
1.37%
jan 1, 1976
76.328
+1.679
2.25%
jan 1, 1977
77.562
+1.234
1.62%
jan 1, 1978
78.216
+0.654
0.84%
jan 1, 1979
79.653
+1.437
1.84%
jan 1, 1980
81.037
+1.384
1.74%
jan 1, 1981
81.943
+0.906
1.12%
jan 1, 1982
81.254
-0.689
-0.84%
jan 1, 1983
84.422
+3.168
3.9%
jan 1, 1984
83.712
-0.71
-0.84%
jan 1, 1985
80.638
-3.073
-3.67%
jan 1, 1986
81.706
+1.068
1.32%
jan 1, 1987
82.395
+0.688
0.84%
jan 1, 1988
83.219
+0.824
1.0%
jan 1, 1989
83.655
+0.436
0.52%
jan 1, 1990
84.784
+1.129
1.35%
jan 1, 1991
85.772
+0.989
1.17%
jan 1, 1992
87.042
+1.269
1.48%
jan 1, 1993
88.216
+1.174
1.35%
jan 1, 1994
90.097
+1.882
2.13%
jan 1, 1995
89.98
-0.117
-0.13%
jan 1, 1996
90.53
+0.55
0.61%
jan 1, 1997
90.9
+0.37
0.41%
jan 1, 1998
91.404
+0.504
0.55%
jan 1, 1999
92.854
+1.45
1.59%
jan 1, 2000
93.767
+0.913
0.98%
jan 1, 2001
93.919
+0.152
0.16%
jan 1, 2002
95.042
+1.123
1.2%
jan 1, 2003
94.685
-0.357
-0.38%
jan 1, 2004
94.178
-0.506
-0.53%
jan 1, 2005
94.249
+0.07
0.07%
jan 1, 2006
94.43
+0.182
0.19%
jan 1, 2007
94.798
+0.368
0.39%
jan 1, 2008
94.561
-0.237
-0.25%
jan 1, 2009
95.078
+0.518
0.55%
jan 1, 2010
95.01
-0.069
-0.07%
jan 1, 2011
95.011
+0.001
0.0%
jan 1, 2012
94.738
-0.273
-0.29%
jan 1, 2013
94.998
+0.26
0.27%
jan 1, 2014
95.059
+0.061
0.06%
Ranking of countries by current statistics by years


Comments: