29
/
en
AIzaSyAYiBZKx7MnpbEhh9jyipgxe19OcubqV5w
April 1, 2024
145560
Guinea
GIN
true
2
1
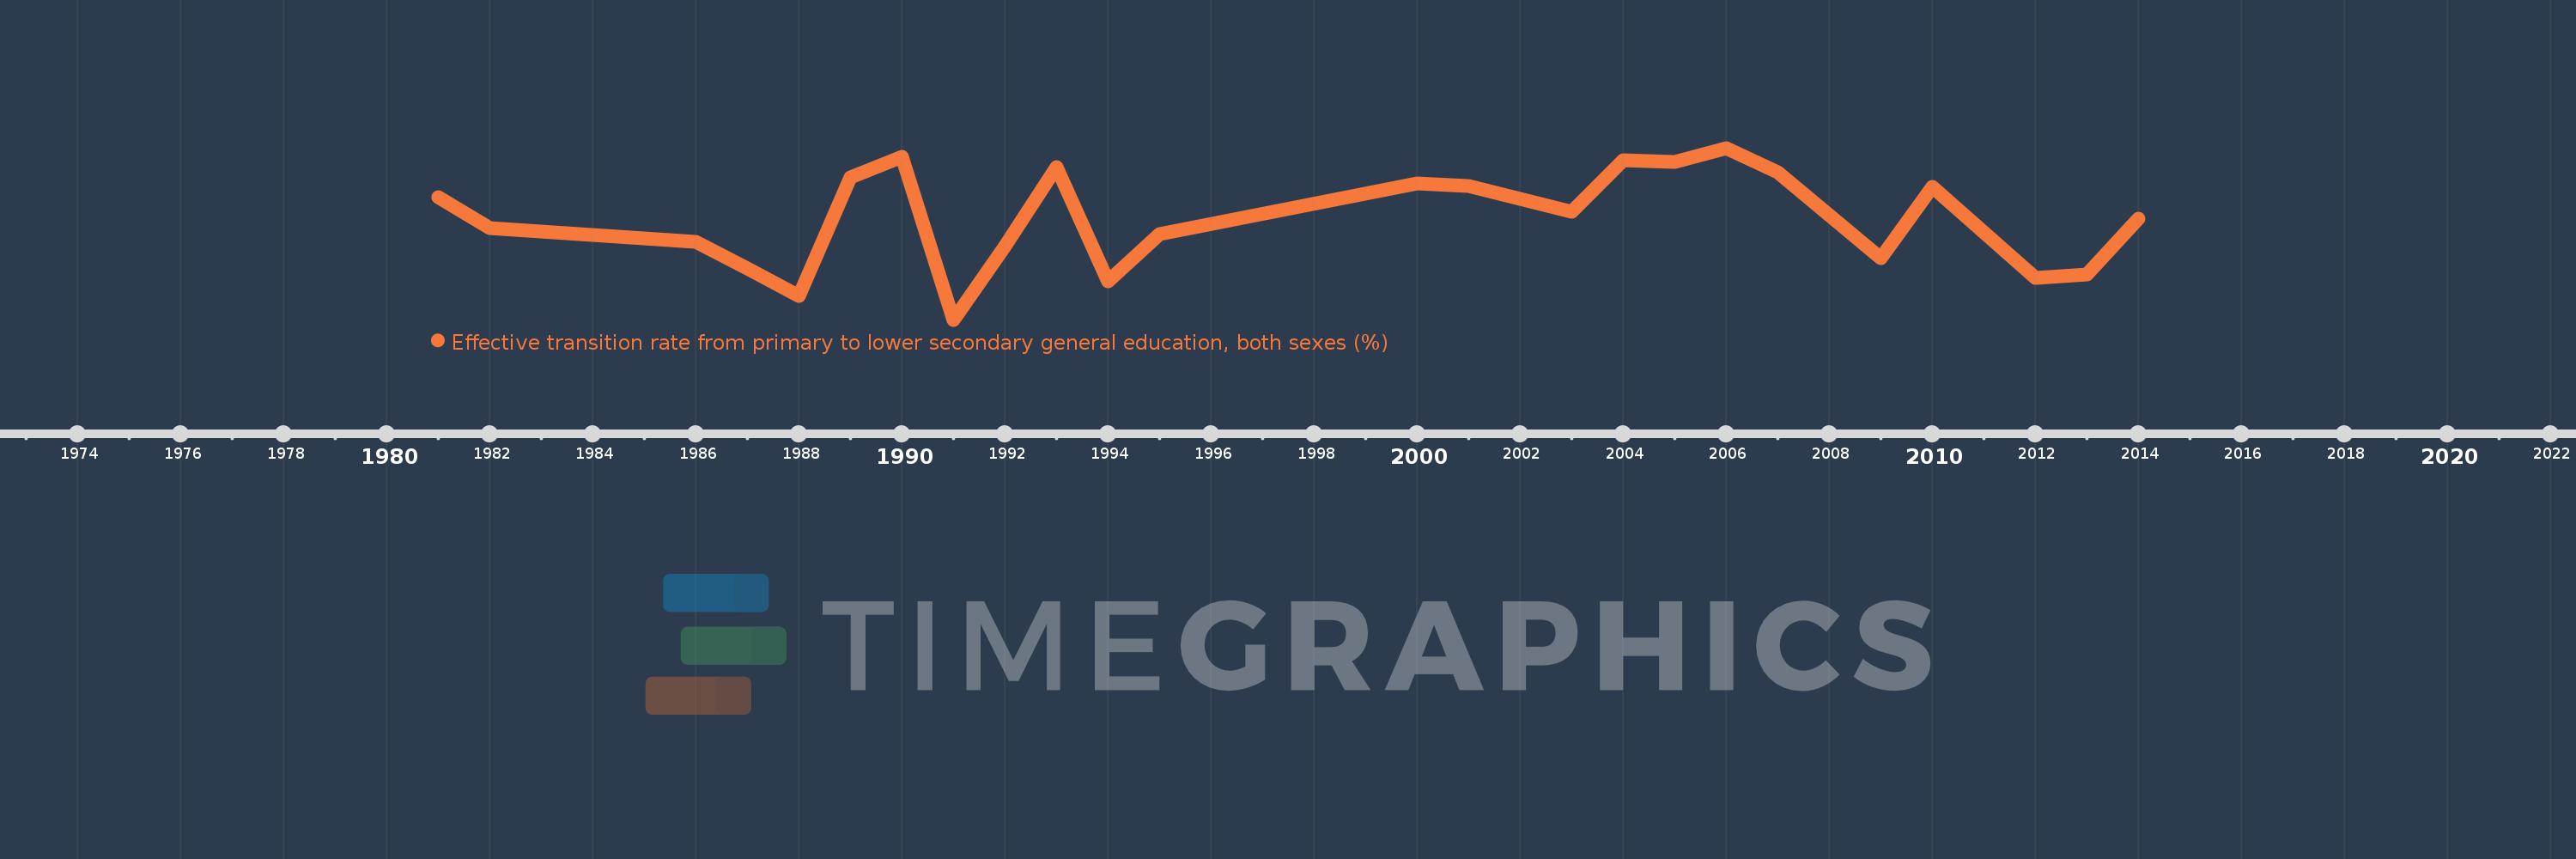
Effective transition rate from primary to lower secondary general education, both sexes (%)
2014,2013,2012,2010,2009,2007,2006,2005,2004,2003,2001,2000,1995,1994,1993,1992,1991,1990,1989,1988,1987,1986,1982,1981
This statistics in other country:
AfghanistanAlbaniaAlgeriaAngolaAntigua and BarbudaArab WorldArgentinaArmeniaArubaAustriaAzerbaijanBahamas, TheBahrainBangladeshBarbadosBelarusBelgiumBelizeBeninBermudaBhutanBoliviaBosnia and HerzegovinaBotswanaBrazilBritish Virgin IslandsBrunei DarussalamBulgariaBurkina FasoBurundiCabo VerdeCambodiaCameroonCaribbean small statesCayman IslandsCentral African RepublicCentral Europe and the BalticsChadChileChinaColombiaComorosCongo, Dem. Rep.Congo, Rep.Costa RicaCote d'IvoireCroatiaCubaCyprusCzech RepublicDenmarkDjiboutiDominicaDominican RepublicEarly-demographic dividendEast Asia & PacificEast Asia & Pacific (excluding high income)East Asia & Pacific (IDA & IBRD countries)EcuadorEgypt, Arab Rep.El SalvadorEquatorial GuineaEritreaEstoniaEthiopiaEuro areaEurope & Central AsiaEurope & Central Asia (excluding high income)Europe & Central Asia (IDA & IBRD countries)European UnionFijiFinlandFragile and conflict affected situationsFranceGabonGambia, TheGeorgiaGermanyGhanaGreeceGrenadaGuatemalaGuineaGuinea-BissauGuyanaHaitiHeavily indebted poor countries (HIPC)High incomeHondurasHong Kong SAR, ChinaHungaryIBRD onlyIcelandIDA & IBRD totalIDA blendIDA onlyIDA totalIndiaIndonesiaIran, Islamic Rep.IraqIsraelItalyJamaicaJapanJordanKazakhstanKenyaKiribatiKorea, Rep.KuwaitKyrgyz RepublicLao PDRLate-demographic dividendLatin America & Caribbean Latin America & Caribbean (excluding high income)Latin America & the Caribbean (IDA & IBRD countries)LatviaLeast developed countries: UN classificationLebanonLesothoLiberiaLibyaLiechtensteinLithuaniaLow & middle incomeLow incomeLower middle incomeLuxembourgMacao SAR, ChinaMacedonia, FYRMadagascarMalawiMalaysiaMaldivesMaliMaltaMarshall IslandsMauritaniaMauritiusMexicoMiddle East & North AfricaMiddle East & North Africa (excluding high income)Middle East & North Africa (IDA & IBRD countries)Middle incomeMoldovaMonacoMongoliaMoroccoMozambiqueMyanmarNamibiaNepalNetherlandsNicaraguaNigerNorwayOECD membersOmanOther small statesPacific island small statesPakistanPalauPanamaParaguayPeruPhilippinesPolandPortugalPost-demographic dividendPre-demographic dividendQatarRomaniaRussian FederationRwandaSamoaSan MarinoSao Tome and PrincipeSaudi ArabiaSenegalSerbiaSeychellesSierra LeoneSingaporeSlovak RepublicSloveniaSmall statesSolomon IslandsSouth AfricaSouth AsiaSouth Asia (IDA & IBRD)SpainSri LankaSt. Kitts and NevisSt. LuciaSt. Vincent and the GrenadinesSub-Saharan Africa Sub-Saharan Africa (excluding high income)Sub-Saharan Africa (IDA & IBRD countries)SudanSurinameSwazilandSwedenSwitzerlandSyrian Arab RepublicTajikistanTanzaniaThailandTimor-LesteTogoTongaTrinidad and TobagoTunisiaTurkeyTurks and Caicos IslandsTuvaluUgandaUkraineUnited Arab EmiratesUpper middle incomeUruguayUzbekistanVanuatuVenezuela, RBVietnamWest Bank and GazaWorldYemen, Rep.ZambiaZimbabwe Timeline:
This timeline shows a graph from 1981 to 2014 of Guinea. No data until 1980. Number of actual observations by date: 24.
Source name:
World Development Indicators
Source organization:
UNESCO Institute for Statistics
Categories, topics:
Education
Last updated:
apr 23, 2017
Indicators value changes by year
Maximum:
86.612
jan 1, 2006
At the date of observation
Value
Absolute change
Change from previous value
jan 1, 1981
74.126
+74.126
0.0%
jan 1, 1982
66.296
-7.83
-10.56%
jan 1, 1986
62.839
-3.457
-5.21%
jan 1, 1987
56.198
-6.641
-10.57%
jan 1, 1988
49.325
-6.873
-12.23%
jan 1, 1989
79.119
+29.794
60.4%
jan 1, 1990
84.459
+5.339
6.75%
jan 1, 1991
43.21
-41.249
-48.84%
jan 1, 1992
61.727
+18.517
42.85%
jan 1, 1993
81.785
+20.059
32.5%
jan 1, 1994
52.819
-28.966
-35.42%
jan 1, 1995
64.893
+12.074
22.86%
jan 1, 2000
77.711
+12.817
19.75%
jan 1, 2001
76.978
-0.733
-0.94%
jan 1, 2003
70.513
-6.464
-8.4%
jan 1, 2004
83.514
+13.0
18.44%
jan 1, 2005
83.078
-0.435
-0.52%
jan 1, 2006
86.612
+3.534
4.25%
jan 1, 2007
80.51
-6.102
-7.05%
jan 1, 2009
58.762
-21.748
-27.01%
jan 1, 2010
76.828
+18.067
30.75%
jan 1, 2012
53.685
-23.143
-30.12%
jan 1, 2013
54.686
+1.001
1.86%
jan 1, 2014
68.786
+14.1
25.78%
Ranking of countries by current statistics by years


Comments: