29
/
en
AIzaSyAYiBZKx7MnpbEhh9jyipgxe19OcubqV5w
April 1, 2024
190122
Mali
MLI
true
2
1
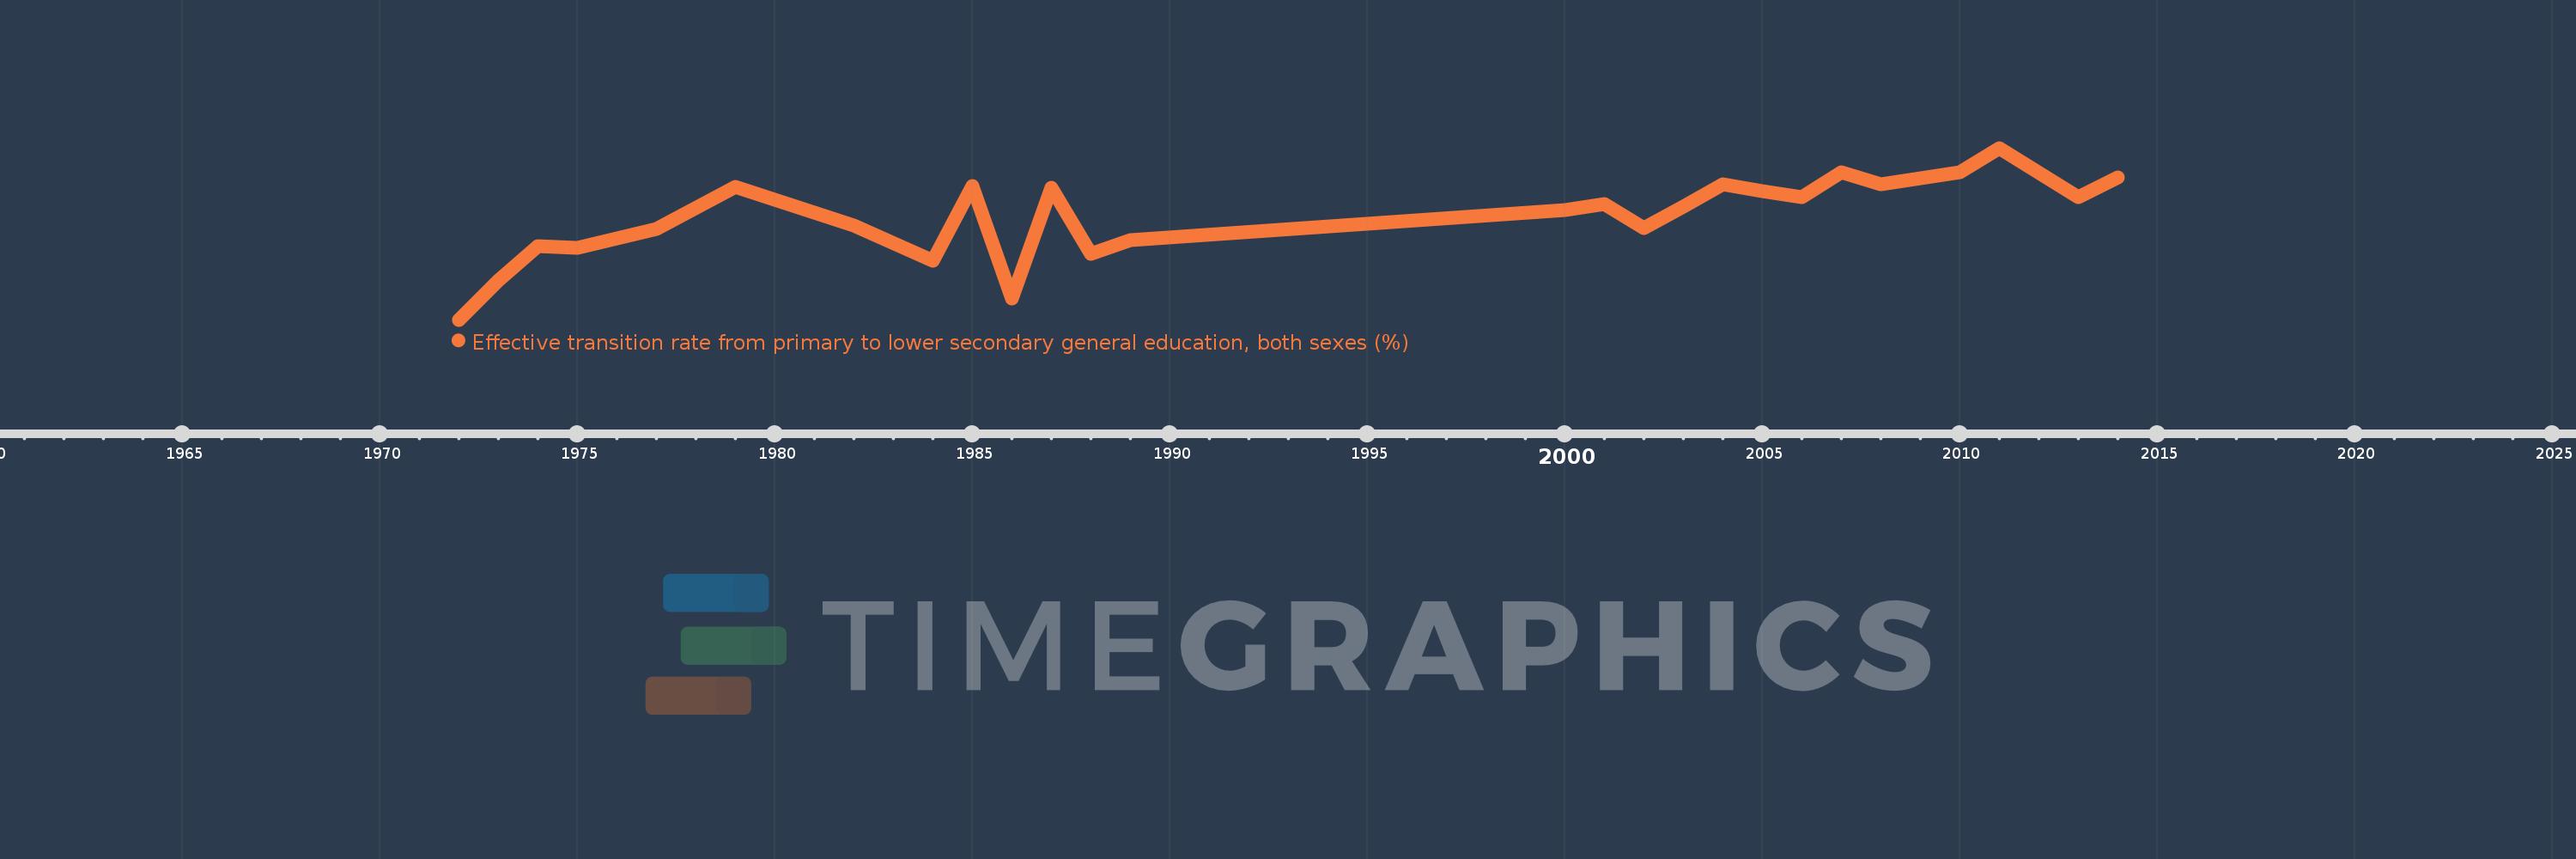
Effective transition rate from primary to lower secondary general education, both sexes (%)
2014,2013,2011,2010,2009,2008,2007,2006,2005,2004,2003,2002,2001,2000,1989,1988,1987,1986,1985,1984,1982,1979,1977,1975,1974,1973,1972
This statistics in other country:
AfghanistanAlbaniaAlgeriaAngolaAntigua and BarbudaArab WorldArgentinaArmeniaArubaAustriaAzerbaijanBahamas, TheBahrainBangladeshBarbadosBelarusBelgiumBelizeBeninBermudaBhutanBoliviaBosnia and HerzegovinaBotswanaBrazilBritish Virgin IslandsBrunei DarussalamBulgariaBurkina FasoBurundiCabo VerdeCambodiaCameroonCaribbean small statesCayman IslandsCentral African RepublicCentral Europe and the BalticsChadChileChinaColombiaComorosCongo, Dem. Rep.Congo, Rep.Costa RicaCote d'IvoireCroatiaCubaCyprusCzech RepublicDenmarkDjiboutiDominicaDominican RepublicEarly-demographic dividendEast Asia & PacificEast Asia & Pacific (excluding high income)East Asia & Pacific (IDA & IBRD countries)EcuadorEgypt, Arab Rep.El SalvadorEquatorial GuineaEritreaEstoniaEthiopiaEuro areaEurope & Central AsiaEurope & Central Asia (excluding high income)Europe & Central Asia (IDA & IBRD countries)European UnionFijiFinlandFragile and conflict affected situationsFranceGabonGambia, TheGeorgiaGermanyGhanaGreeceGrenadaGuatemalaGuineaGuinea-BissauGuyanaHaitiHeavily indebted poor countries (HIPC)High incomeHondurasHong Kong SAR, ChinaHungaryIBRD onlyIcelandIDA & IBRD totalIDA blendIDA onlyIDA totalIndiaIndonesiaIran, Islamic Rep.IraqIsraelItalyJamaicaJapanJordanKazakhstanKenyaKiribatiKorea, Rep.KuwaitKyrgyz RepublicLao PDRLate-demographic dividendLatin America & Caribbean Latin America & Caribbean (excluding high income)Latin America & the Caribbean (IDA & IBRD countries)LatviaLeast developed countries: UN classificationLebanonLesothoLiberiaLibyaLiechtensteinLithuaniaLow & middle incomeLow incomeLower middle incomeLuxembourgMacao SAR, ChinaMacedonia, FYRMadagascarMalawiMalaysiaMaldivesMaliMaltaMarshall IslandsMauritaniaMauritiusMexicoMiddle East & North AfricaMiddle East & North Africa (excluding high income)Middle East & North Africa (IDA & IBRD countries)Middle incomeMoldovaMonacoMongoliaMoroccoMozambiqueMyanmarNamibiaNepalNetherlandsNicaraguaNigerNorwayOECD membersOmanOther small statesPacific island small statesPakistanPalauPanamaParaguayPeruPhilippinesPolandPortugalPost-demographic dividendPre-demographic dividendQatarRomaniaRussian FederationRwandaSamoaSan MarinoSao Tome and PrincipeSaudi ArabiaSenegalSerbiaSeychellesSierra LeoneSingaporeSlovak RepublicSloveniaSmall statesSolomon IslandsSouth AfricaSouth AsiaSouth Asia (IDA & IBRD)SpainSri LankaSt. Kitts and NevisSt. LuciaSt. Vincent and the GrenadinesSub-Saharan Africa Sub-Saharan Africa (excluding high income)Sub-Saharan Africa (IDA & IBRD countries)SudanSurinameSwazilandSwedenSwitzerlandSyrian Arab RepublicTajikistanTanzaniaThailandTimor-LesteTogoTongaTrinidad and TobagoTunisiaTurkeyTurks and Caicos IslandsTuvaluUgandaUkraineUnited Arab EmiratesUpper middle incomeUruguayUzbekistanVanuatuVenezuela, RBVietnamWest Bank and GazaWorldYemen, Rep.ZambiaZimbabwe Timeline:
This timeline shows a graph from 1972 to 2014 of Mali. No data until 1971. Number of actual observations by date: 27.
Source name:
World Development Indicators
Source organization:
UNESCO Institute for Statistics
Categories, topics:
Education
Last updated:
apr 23, 2017
Indicators value changes by year
Minimum:
47.093
jan 1, 1972
At the date of observation
Value
Absolute change
Change from previous value
jan 1, 1972
47.093
+47.093
0.0%
jan 1, 1973
57.504
+10.41
22.11%
jan 1, 1974
66.617
+9.114
15.85%
jan 1, 1975
66.263
-0.354
-0.53%
jan 1, 1977
71.314
+5.051
7.62%
jan 1, 1979
82.422
+11.108
15.58%
jan 1, 1982
72.158
-10.264
-12.45%
jan 1, 1984
62.922
-9.236
-12.8%
jan 1, 1985
82.843
+19.921
31.66%
jan 1, 1986
52.713
-30.13
-36.37%
jan 1, 1987
82.334
+29.62
56.19%
jan 1, 1988
64.611
-17.723
-21.53%
jan 1, 1989
68.379
+3.768
5.83%
jan 1, 2000
76.43
+8.051
11.77%
jan 1, 2001
77.941
+1.511
1.98%
jan 1, 2002
71.624
-6.317
-8.1%
jan 1, 2003
77.363
+5.739
8.01%
jan 1, 2004
83.127
+5.764
7.45%
jan 1, 2005
81.331
-1.796
-2.16%
jan 1, 2006
79.677
-1.654
-2.03%
jan 1, 2007
86.327
+6.65
8.35%
jan 1, 2008
83.163
-3.164
-3.67%
jan 1, 2009
84.798
+1.635
1.97%
jan 1, 2010
86.329
+1.531
1.81%
jan 1, 2011
92.89
+6.561
7.6%
jan 1, 2013
79.871
-13.019
-14.02%
jan 1, 2014
85.062
+5.191
6.5%
Ranking of countries by current statistics by years


Comments: