29
/
en
AIzaSyAYiBZKx7MnpbEhh9jyipgxe19OcubqV5w
April 1, 2024
227307
Qatar
QAT
true
2
1
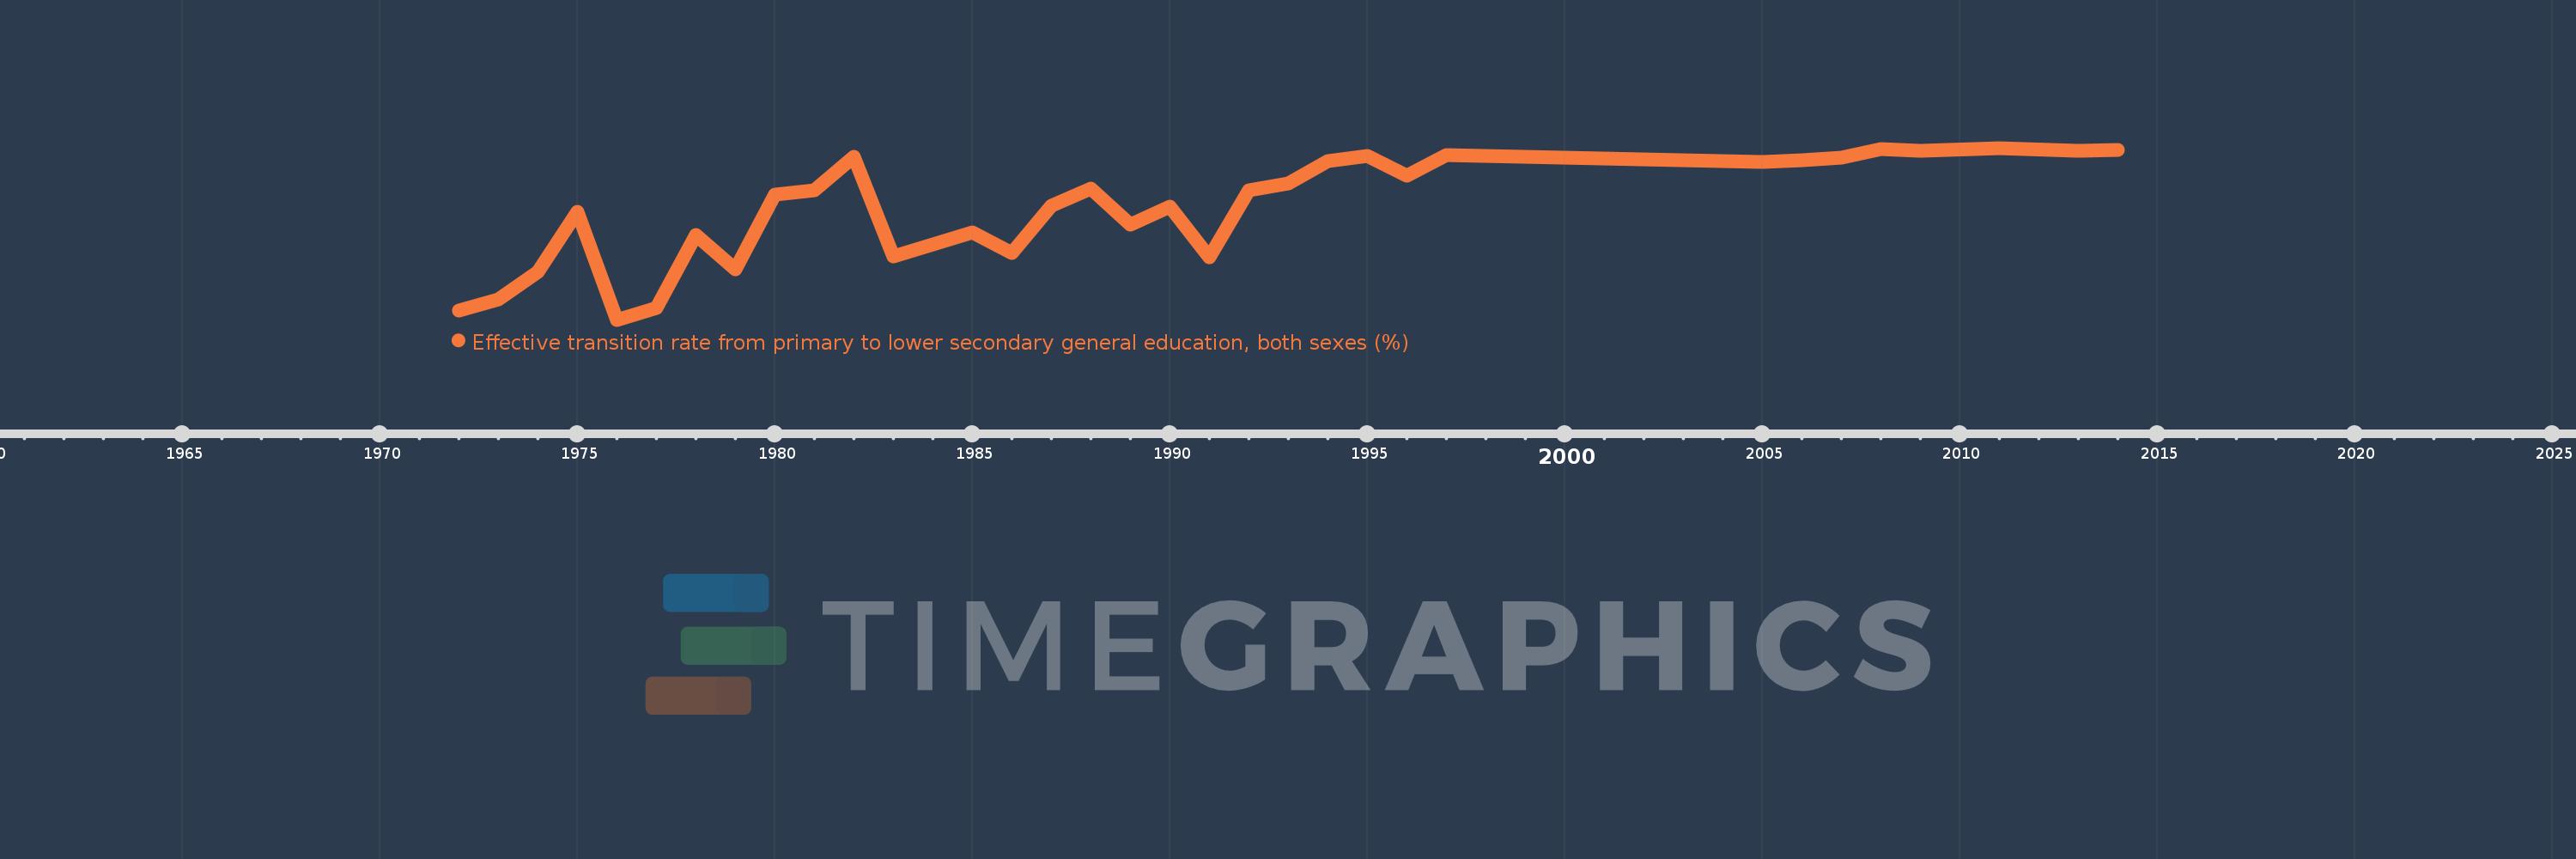
Effective transition rate from primary to lower secondary general education, both sexes (%)
2014,2013,2011,2009,2008,2007,2006,2005,1997,1996,1995,1994,1993,1992,1991,1990,1989,1988,1987,1986,1985,1983,1982,1981,1980,1979,1978,1977,1976,1975,1974,1973,1972
This statistics in other country:
AfghanistanAlbaniaAlgeriaAngolaAntigua and BarbudaArab WorldArgentinaArmeniaArubaAustriaAzerbaijanBahamas, TheBahrainBangladeshBarbadosBelarusBelgiumBelizeBeninBermudaBhutanBoliviaBosnia and HerzegovinaBotswanaBrazilBritish Virgin IslandsBrunei DarussalamBulgariaBurkina FasoBurundiCabo VerdeCambodiaCameroonCaribbean small statesCayman IslandsCentral African RepublicCentral Europe and the BalticsChadChileChinaColombiaComorosCongo, Dem. Rep.Congo, Rep.Costa RicaCote d'IvoireCroatiaCubaCyprusCzech RepublicDenmarkDjiboutiDominicaDominican RepublicEarly-demographic dividendEast Asia & PacificEast Asia & Pacific (excluding high income)East Asia & Pacific (IDA & IBRD countries)EcuadorEgypt, Arab Rep.El SalvadorEquatorial GuineaEritreaEstoniaEthiopiaEuro areaEurope & Central AsiaEurope & Central Asia (excluding high income)Europe & Central Asia (IDA & IBRD countries)European UnionFijiFinlandFragile and conflict affected situationsFranceGabonGambia, TheGeorgiaGermanyGhanaGreeceGrenadaGuatemalaGuineaGuinea-BissauGuyanaHaitiHeavily indebted poor countries (HIPC)High incomeHondurasHong Kong SAR, ChinaHungaryIBRD onlyIcelandIDA & IBRD totalIDA blendIDA onlyIDA totalIndiaIndonesiaIran, Islamic Rep.IraqIsraelItalyJamaicaJapanJordanKazakhstanKenyaKiribatiKorea, Rep.KuwaitKyrgyz RepublicLao PDRLate-demographic dividendLatin America & Caribbean Latin America & Caribbean (excluding high income)Latin America & the Caribbean (IDA & IBRD countries)LatviaLeast developed countries: UN classificationLebanonLesothoLiberiaLibyaLiechtensteinLithuaniaLow & middle incomeLow incomeLower middle incomeLuxembourgMacao SAR, ChinaMacedonia, FYRMadagascarMalawiMalaysiaMaldivesMaliMaltaMarshall IslandsMauritaniaMauritiusMexicoMiddle East & North AfricaMiddle East & North Africa (excluding high income)Middle East & North Africa (IDA & IBRD countries)Middle incomeMoldovaMonacoMongoliaMoroccoMozambiqueMyanmarNamibiaNepalNetherlandsNicaraguaNigerNorwayOECD membersOmanOther small statesPacific island small statesPakistanPalauPanamaParaguayPeruPhilippinesPolandPortugalPost-demographic dividendPre-demographic dividendQatarRomaniaRussian FederationRwandaSamoaSan MarinoSao Tome and PrincipeSaudi ArabiaSenegalSerbiaSeychellesSierra LeoneSingaporeSlovak RepublicSloveniaSmall statesSolomon IslandsSouth AfricaSouth AsiaSouth Asia (IDA & IBRD)SpainSri LankaSt. Kitts and NevisSt. LuciaSt. Vincent and the GrenadinesSub-Saharan Africa Sub-Saharan Africa (excluding high income)Sub-Saharan Africa (IDA & IBRD countries)SudanSurinameSwazilandSwedenSwitzerlandSyrian Arab RepublicTajikistanTanzaniaThailandTimor-LesteTogoTongaTrinidad and TobagoTunisiaTurkeyTurks and Caicos IslandsTuvaluUgandaUkraineUnited Arab EmiratesUpper middle incomeUruguayUzbekistanVanuatuVenezuela, RBVietnamWest Bank and GazaWorldYemen, Rep.ZambiaZimbabwe Timeline:
This timeline shows a graph from 1972 to 2014 of Qatar. No data until 1971. Number of actual observations by date: 33.
Source name:
World Development Indicators
Source organization:
UNESCO Institute for Statistics
Categories, topics:
Education
Last updated:
apr 23, 2017
Indicators value changes by year
Maximum:
99.974
jan 1, 2011
At the date of observation
Value
Absolute change
Change from previous value
jan 1, 1972
81.448
+81.448
0.0%
jan 1, 1973
82.719
+1.27
1.56%
jan 1, 1974
85.864
+3.146
3.8%
jan 1, 1975
92.711
+6.847
7.97%
jan 1, 1976
80.45
-12.261
-13.22%
jan 1, 1977
81.759
+1.309
1.63%
jan 1, 1978
90.047
+8.288
10.14%
jan 1, 1979
86.221
-3.825
-4.25%
jan 1, 1980
94.685
+8.463
9.82%
jan 1, 1981
95.134
+0.45
0.47%
jan 1, 1982
99.008
+3.874
4.07%
jan 1, 1983
87.619
-11.39
-11.5%
jan 1, 1985
90.339
+2.72
3.1%
jan 1, 1986
88.003
-2.336
-2.59%
jan 1, 1987
93.443
+5.44
6.18%
jan 1, 1988
95.327
+1.884
2.02%
jan 1, 1989
91.299
-4.028
-4.23%
jan 1, 1990
93.341
+2.042
2.24%
jan 1, 1991
87.59
-5.751
-6.16%
jan 1, 1992
95.172
+7.581
8.66%
jan 1, 1993
95.926
+0.755
0.79%
jan 1, 1994
98.466
+2.54
2.65%
jan 1, 1995
99.112
+0.646
0.66%
jan 1, 1996
96.823
-2.289
-2.31%
jan 1, 1997
99.154
+2.331
2.41%
jan 1, 2005
98.353
-0.801
-0.81%
jan 1, 2006
98.587
+0.234
0.24%
jan 1, 2007
98.849
+0.262
0.27%
jan 1, 2008
99.895
+1.045
1.06%
jan 1, 2009
99.613
-0.281
-0.28%
jan 1, 2011
99.974
+0.361
0.36%
jan 1, 2013
99.7
-0.274
-0.27%
jan 1, 2014
99.765
+0.065
0.06%
Ranking of countries by current statistics by years


Comments: