29
/
en
AIzaSyAYiBZKx7MnpbEhh9jyipgxe19OcubqV5w
April 1, 2024
93436
Bulgaria
BGR
true
2
1
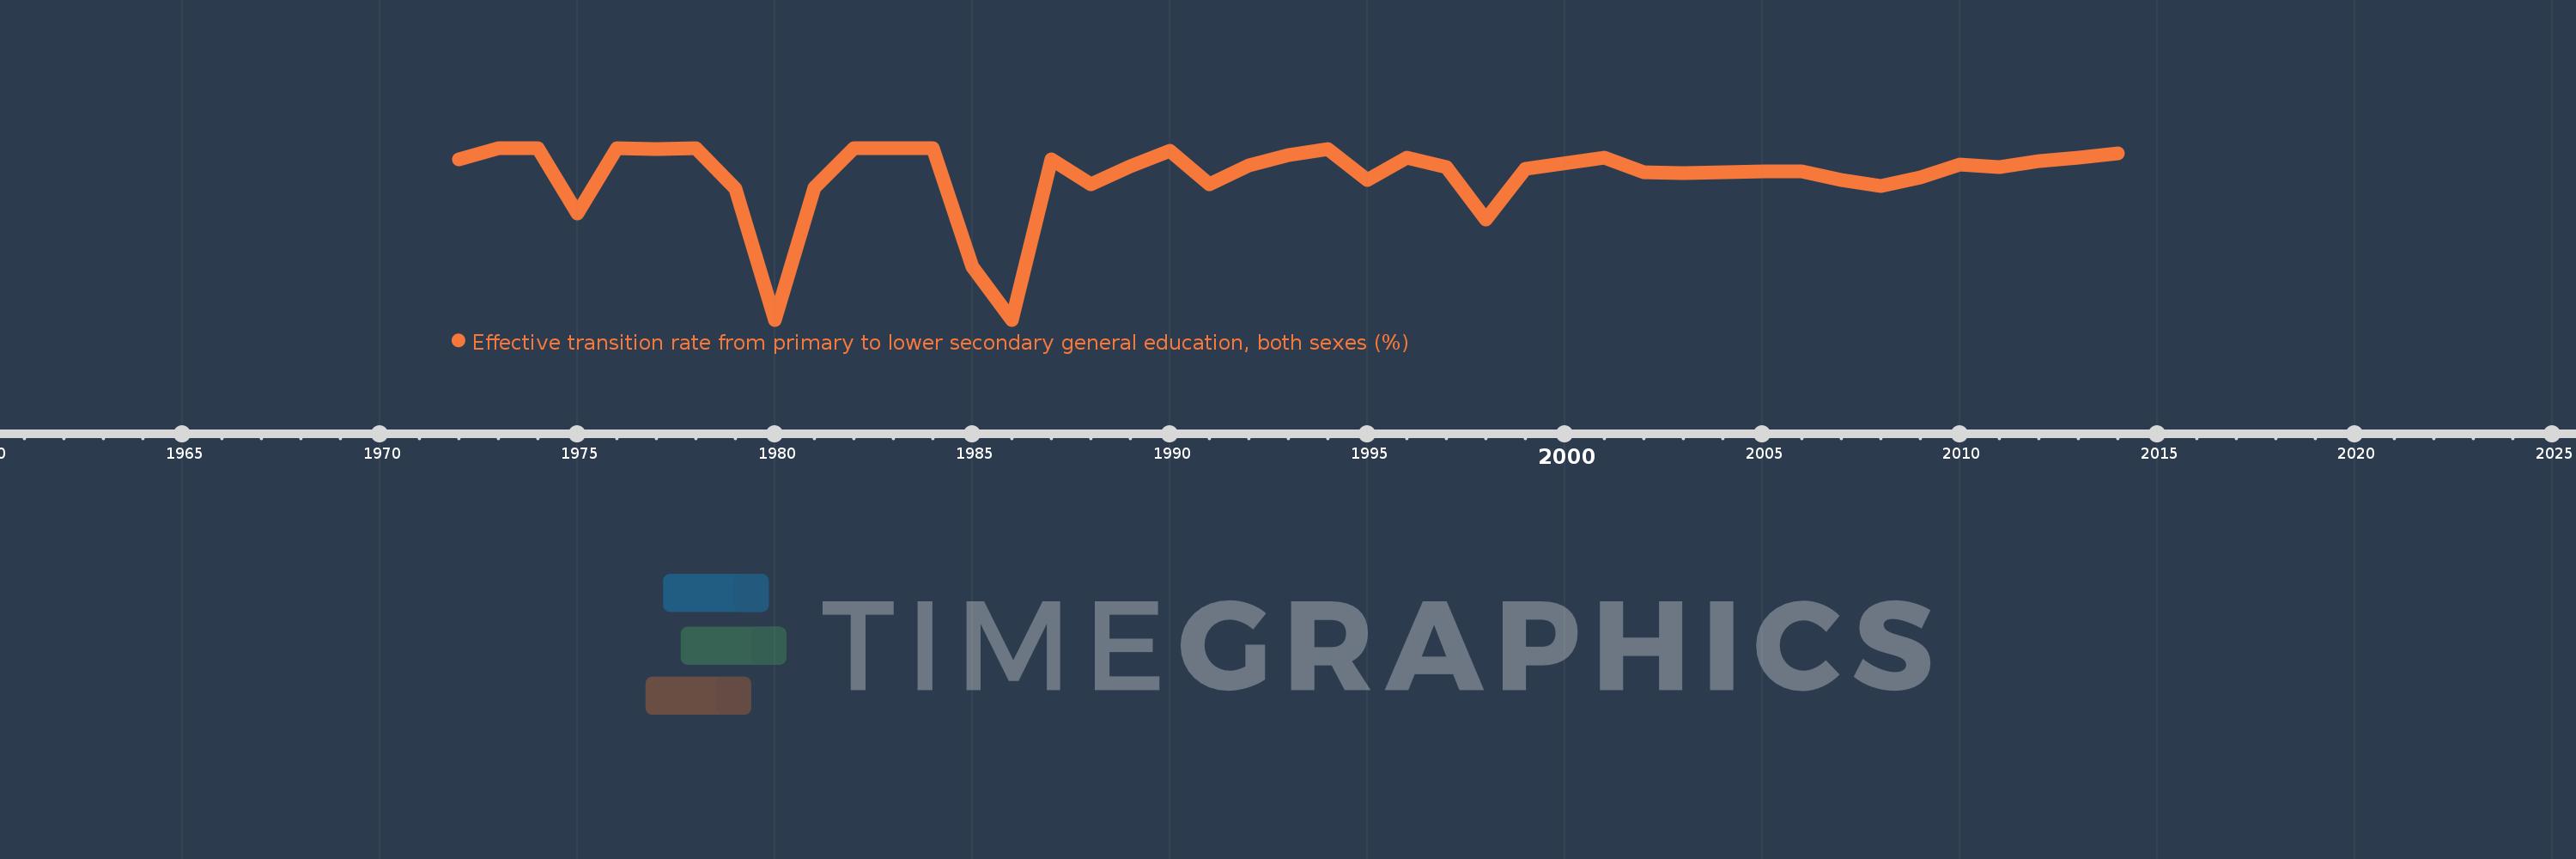
Effective transition rate from primary to lower secondary general education, both sexes (%)
2014,2013,2012,2011,2010,2009,2008,2007,2006,2005,2004,2003,2002,2001,1999,1998,1997,1996,1995,1994,1993,1992,1991,1990,1989,1988,1987,1986,1985,1984,1983,1982,1981,1980,1979,1978,1977,1976,1975,1974,1973,1972
This statistics in other country:
AfghanistanAlbaniaAlgeriaAngolaAntigua and BarbudaArab WorldArgentinaArmeniaArubaAustriaAzerbaijanBahamas, TheBahrainBangladeshBarbadosBelarusBelgiumBelizeBeninBermudaBhutanBoliviaBosnia and HerzegovinaBotswanaBrazilBritish Virgin IslandsBrunei DarussalamBulgariaBurkina FasoBurundiCabo VerdeCambodiaCameroonCaribbean small statesCayman IslandsCentral African RepublicCentral Europe and the BalticsChadChileChinaColombiaComorosCongo, Dem. Rep.Congo, Rep.Costa RicaCote d'IvoireCroatiaCubaCyprusCzech RepublicDenmarkDjiboutiDominicaDominican RepublicEarly-demographic dividendEast Asia & PacificEast Asia & Pacific (excluding high income)East Asia & Pacific (IDA & IBRD countries)EcuadorEgypt, Arab Rep.El SalvadorEquatorial GuineaEritreaEstoniaEthiopiaEuro areaEurope & Central AsiaEurope & Central Asia (excluding high income)Europe & Central Asia (IDA & IBRD countries)European UnionFijiFinlandFragile and conflict affected situationsFranceGabonGambia, TheGeorgiaGermanyGhanaGreeceGrenadaGuatemalaGuineaGuinea-BissauGuyanaHaitiHeavily indebted poor countries (HIPC)High incomeHondurasHong Kong SAR, ChinaHungaryIBRD onlyIcelandIDA & IBRD totalIDA blendIDA onlyIDA totalIndiaIndonesiaIran, Islamic Rep.IraqIsraelItalyJamaicaJapanJordanKazakhstanKenyaKiribatiKorea, Rep.KuwaitKyrgyz RepublicLao PDRLate-demographic dividendLatin America & Caribbean Latin America & Caribbean (excluding high income)Latin America & the Caribbean (IDA & IBRD countries)LatviaLeast developed countries: UN classificationLebanonLesothoLiberiaLibyaLiechtensteinLithuaniaLow & middle incomeLow incomeLower middle incomeLuxembourgMacao SAR, ChinaMacedonia, FYRMadagascarMalawiMalaysiaMaldivesMaliMaltaMarshall IslandsMauritaniaMauritiusMexicoMiddle East & North AfricaMiddle East & North Africa (excluding high income)Middle East & North Africa (IDA & IBRD countries)Middle incomeMoldovaMonacoMongoliaMoroccoMozambiqueMyanmarNamibiaNepalNetherlandsNicaraguaNigerNorwayOECD membersOmanOther small statesPacific island small statesPakistanPalauPanamaParaguayPeruPhilippinesPolandPortugalPost-demographic dividendPre-demographic dividendQatarRomaniaRussian FederationRwandaSamoaSan MarinoSao Tome and PrincipeSaudi ArabiaSenegalSerbiaSeychellesSierra LeoneSingaporeSlovak RepublicSloveniaSmall statesSolomon IslandsSouth AfricaSouth AsiaSouth Asia (IDA & IBRD)SpainSri LankaSt. Kitts and NevisSt. LuciaSt. Vincent and the GrenadinesSub-Saharan Africa Sub-Saharan Africa (excluding high income)Sub-Saharan Africa (IDA & IBRD countries)SudanSurinameSwazilandSwedenSwitzerlandSyrian Arab RepublicTajikistanTanzaniaThailandTimor-LesteTogoTongaTrinidad and TobagoTunisiaTurkeyTurks and Caicos IslandsTuvaluUgandaUkraineUnited Arab EmiratesUpper middle incomeUruguayUzbekistanVanuatuVenezuela, RBVietnamWest Bank and GazaWorldYemen, Rep.ZambiaZimbabwe Timeline:
This timeline shows a graph from 1972 to 2014 of Bulgaria. No data until 1971. Number of actual observations by date: 42.
Source name:
World Development Indicators
Source organization:
UNESCO Institute for Statistics
Categories, topics:
Education
Last updated:
apr 23, 2017
Indicators value changes by year
Minimum:
87.876
jan 1, 1980
At the date of observation
Value
Absolute change
Change from previous value
jan 1, 1972
99.179
+99.179
0.0%
jan 1, 1973
100.0
+0.821
0.83%
jan 1, 1974
100.0
0.0
0.0%
jan 1, 1975
95.382
-4.618
-4.62%
jan 1, 1976
100.0
+4.618
4.84%
jan 1, 1977
99.897
-0.103
-0.1%
jan 1, 1978
100.0
+0.103
0.1%
jan 1, 1979
97.142
-2.858
-2.86%
jan 1, 1980
87.876
-9.267
-9.54%
jan 1, 1981
97.181
+9.305
10.59%
jan 1, 1982
100.0
+2.819
2.9%
jan 1, 1983
100.0
0.0
0.0%
jan 1, 1984
100.0
0.0
0.0%
jan 1, 1985
91.62
-8.38
-8.38%
jan 1, 1986
87.886
-3.734
-4.08%
jan 1, 1987
99.184
+11.298
12.86%
jan 1, 1988
97.409
-1.775
-1.79%
jan 1, 1989
98.699
+1.29
1.32%
jan 1, 1990
99.782
+1.083
1.1%
jan 1, 1991
97.429
-2.353
-2.36%
jan 1, 1992
98.762
+1.333
1.37%
jan 1, 1993
99.524
+0.761
0.77%
jan 1, 1994
99.931
+0.407
0.41%
jan 1, 1995
97.721
-2.209
-2.21%
jan 1, 1996
99.296
+1.575
1.61%
jan 1, 1997
98.671
-0.625
-0.63%
jan 1, 1998
94.953
-3.718
-3.77%
jan 1, 1999
98.555
+3.602
3.79%
jan 1, 2001
99.338
+0.783
0.79%
jan 1, 2002
98.283
-1.056
-1.06%
jan 1, 2003
98.225
-0.058
-0.06%
jan 1, 2004
98.295
+0.071
0.07%
jan 1, 2005
98.336
+0.041
0.04%
jan 1, 2006
98.329
-0.008
-0.01%
jan 1, 2007
97.72
-0.609
-0.62%
jan 1, 2008
97.313
-0.407
-0.42%
jan 1, 2009
97.916
+0.604
0.62%
jan 1, 2010
98.805
+0.889
0.91%
jan 1, 2011
98.669
-0.137
-0.14%
jan 1, 2012
99.054
+0.385
0.39%
jan 1, 2013
99.297
+0.243
0.24%
jan 1, 2014
99.601
+0.304
0.31%
Ranking of countries by current statistics by years


Comments: