29
/
en
AIzaSyAYiBZKx7MnpbEhh9jyipgxe19OcubqV5w
April 1, 2024
58843
Sub-Saharan Africa
SSF
false
2
1
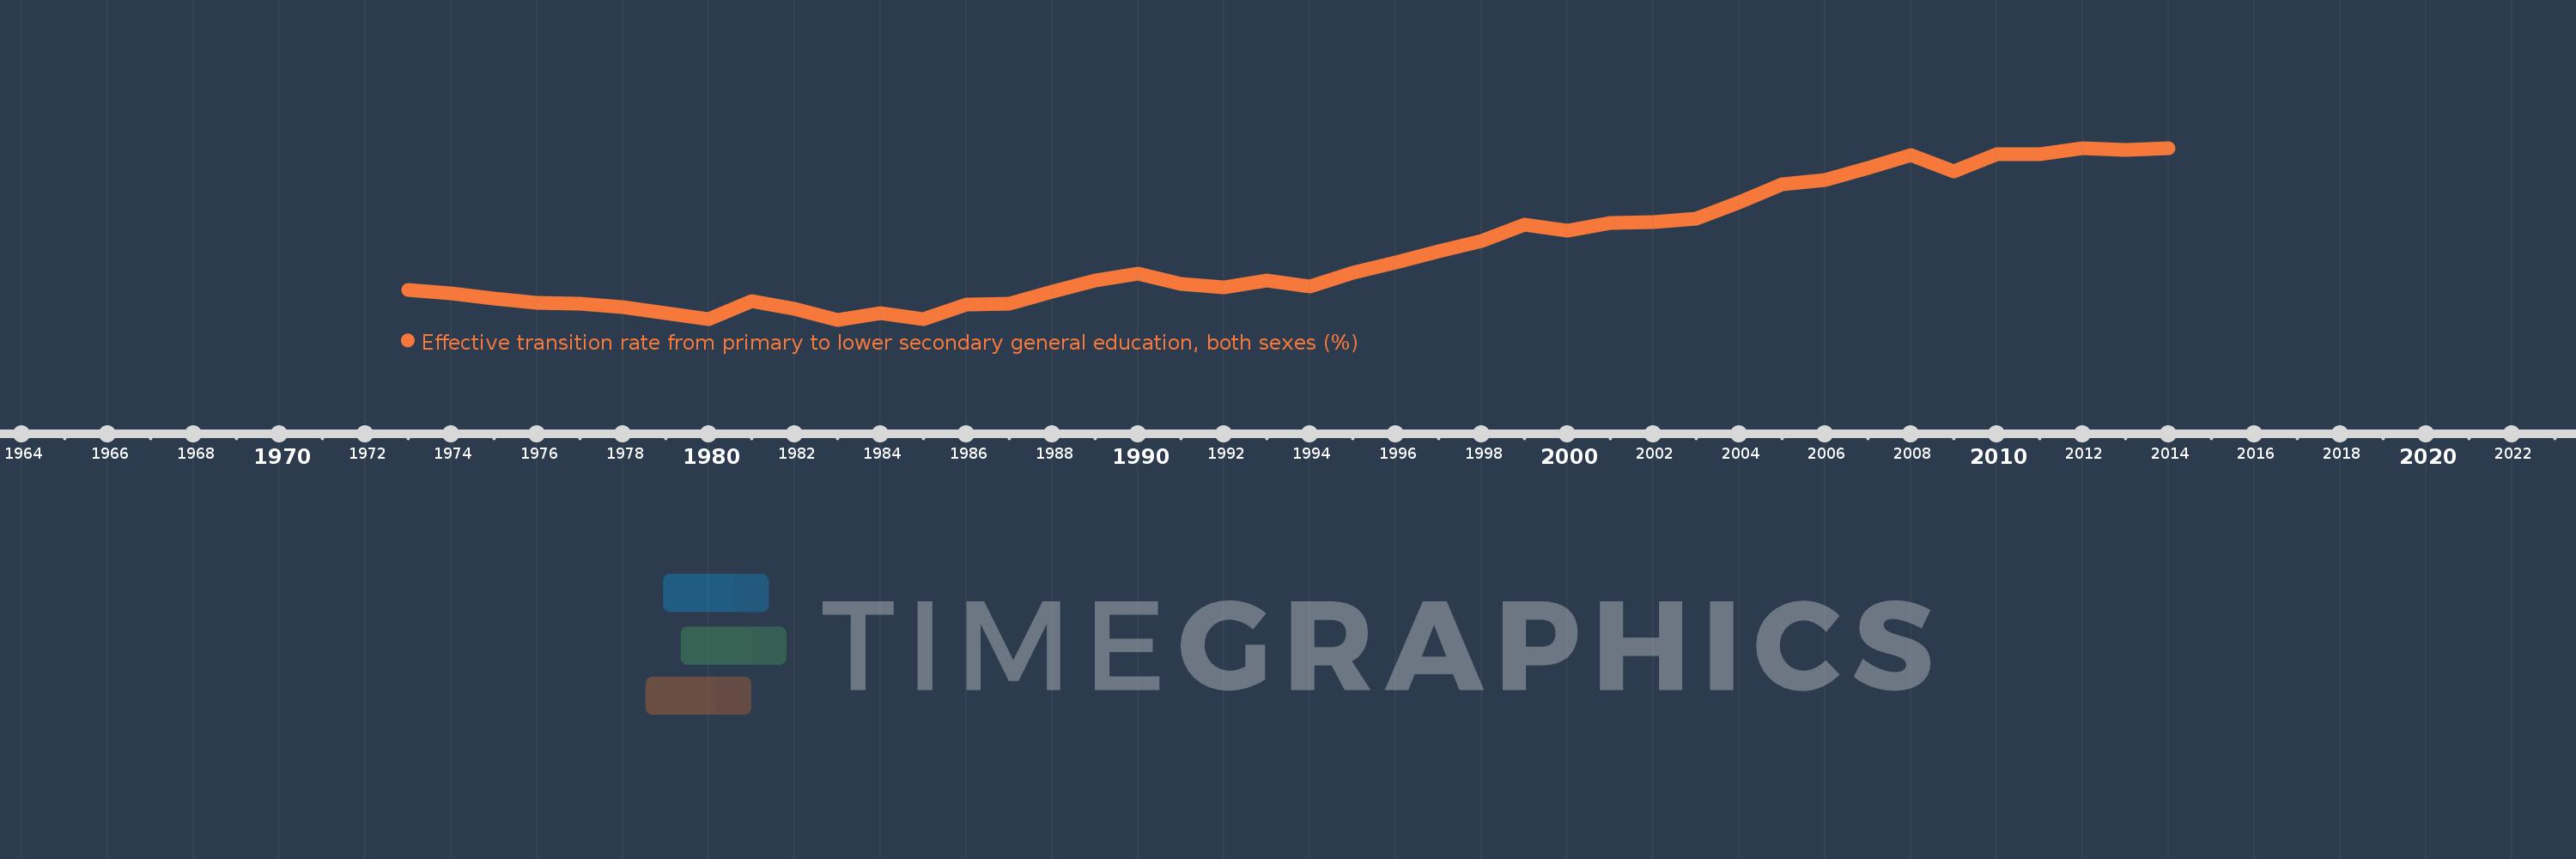
Effective transition rate from primary to lower secondary general education, both sexes (%)
2014,2013,2012,2011,2010,2009,2008,2007,2006,2005,2004,2003,2002,2001,2000,1999,1998,1997,1996,1995,1994,1993,1992,1991,1990,1989,1988,1987,1986,1985,1984,1983,1982,1981,1980,1979,1978,1977,1976,1975,1974,1973
This statistics in other country:
AfghanistanAlbaniaAlgeriaAngolaAntigua and BarbudaArab WorldArgentinaArmeniaArubaAustriaAzerbaijanBahamas, TheBahrainBangladeshBarbadosBelarusBelgiumBelizeBeninBermudaBhutanBoliviaBosnia and HerzegovinaBotswanaBrazilBritish Virgin IslandsBrunei DarussalamBulgariaBurkina FasoBurundiCabo VerdeCambodiaCameroonCaribbean small statesCayman IslandsCentral African RepublicCentral Europe and the BalticsChadChileChinaColombiaComorosCongo, Dem. Rep.Congo, Rep.Costa RicaCote d'IvoireCroatiaCubaCyprusCzech RepublicDenmarkDjiboutiDominicaDominican RepublicEarly-demographic dividendEast Asia & PacificEast Asia & Pacific (excluding high income)East Asia & Pacific (IDA & IBRD countries)EcuadorEgypt, Arab Rep.El SalvadorEquatorial GuineaEritreaEstoniaEthiopiaEuro areaEurope & Central AsiaEurope & Central Asia (excluding high income)Europe & Central Asia (IDA & IBRD countries)European UnionFijiFinlandFragile and conflict affected situationsFranceGabonGambia, TheGeorgiaGermanyGhanaGreeceGrenadaGuatemalaGuineaGuinea-BissauGuyanaHaitiHeavily indebted poor countries (HIPC)High incomeHondurasHong Kong SAR, ChinaHungaryIBRD onlyIcelandIDA & IBRD totalIDA blendIDA onlyIDA totalIndiaIndonesiaIran, Islamic Rep.IraqIsraelItalyJamaicaJapanJordanKazakhstanKenyaKiribatiKorea, Rep.KuwaitKyrgyz RepublicLao PDRLate-demographic dividendLatin America & Caribbean Latin America & Caribbean (excluding high income)Latin America & the Caribbean (IDA & IBRD countries)LatviaLeast developed countries: UN classificationLebanonLesothoLiberiaLibyaLiechtensteinLithuaniaLow & middle incomeLow incomeLower middle incomeLuxembourgMacao SAR, ChinaMacedonia, FYRMadagascarMalawiMalaysiaMaldivesMaliMaltaMarshall IslandsMauritaniaMauritiusMexicoMiddle East & North AfricaMiddle East & North Africa (excluding high income)Middle East & North Africa (IDA & IBRD countries)Middle incomeMoldovaMonacoMongoliaMoroccoMozambiqueMyanmarNamibiaNepalNetherlandsNicaraguaNigerNorwayOECD membersOmanOther small statesPacific island small statesPakistanPalauPanamaParaguayPeruPhilippinesPolandPortugalPost-demographic dividendPre-demographic dividendQatarRomaniaRussian FederationRwandaSamoaSan MarinoSao Tome and PrincipeSaudi ArabiaSenegalSerbiaSeychellesSierra LeoneSingaporeSlovak RepublicSloveniaSmall statesSolomon IslandsSouth AfricaSouth AsiaSouth Asia (IDA & IBRD)SpainSri LankaSt. Kitts and NevisSt. LuciaSt. Vincent and the GrenadinesSub-Saharan Africa Sub-Saharan Africa (excluding high income)Sub-Saharan Africa (IDA & IBRD countries)SudanSurinameSwazilandSwedenSwitzerlandSyrian Arab RepublicTajikistanTanzaniaThailandTimor-LesteTogoTongaTrinidad and TobagoTunisiaTurkeyTurks and Caicos IslandsTuvaluUgandaUkraineUnited Arab EmiratesUpper middle incomeUruguayUzbekistanVanuatuVenezuela, RBVietnamWest Bank and GazaWorldYemen, Rep.ZambiaZimbabwe Timeline:
This timeline shows a graph from 1973 to 2014 of Sub-Saharan Africa . No data until 1972. Number of actual observations by date: 42.
Source name:
World Development Indicators
Source organization:
UNESCO Institute for Statistics
Categories, topics:
Education
Last updated:
apr 23, 2017
Indicators value changes by year
Minimum:
59.903
jan 1, 1983
Maximum:
78.869
jan 1, 2014
At the date of observation
Value
Absolute change
Change from previous value
jan 1, 1973
63.217
+63.217
0.0%
jan 1, 1974
62.807
-0.41
-0.65%
jan 1, 1975
62.204
-0.603
-0.96%
jan 1, 1976
61.808
-0.396
-0.64%
jan 1, 1977
61.664
-0.145
-0.23%
jan 1, 1978
61.337
-0.327
-0.53%
jan 1, 1979
60.602
-0.734
-1.2%
jan 1, 1980
60.0
-0.602
-0.99%
jan 1, 1981
61.994
+1.994
3.32%
jan 1, 1982
61.091
-0.903
-1.46%
jan 1, 1983
59.903
-1.188
-1.95%
jan 1, 1984
60.67
+0.767
1.28%
jan 1, 1985
59.934
-0.736
-1.21%
jan 1, 1986
61.618
+1.684
2.81%
jan 1, 1987
61.646
+0.028
0.05%
jan 1, 1988
62.977
+1.331
2.16%
jan 1, 1989
64.23
+1.253
1.99%
jan 1, 1990
64.948
+0.718
1.12%
jan 1, 1991
63.851
-1.097
-1.69%
jan 1, 1992
63.473
-0.378
-0.59%
jan 1, 1993
64.201
+0.729
1.15%
jan 1, 1994
63.587
-0.614
-0.96%
jan 1, 1995
65.061
+1.474
2.32%
jan 1, 1996
66.201
+1.14
1.75%
jan 1, 1997
67.458
+1.257
1.9%
jan 1, 1998
68.552
+1.094
1.62%
jan 1, 1999
70.436
+1.884
2.75%
jan 1, 2000
69.739
-0.697
-0.99%
jan 1, 2001
70.569
+0.83
1.19%
jan 1, 2002
70.714
+0.145
0.21%
jan 1, 2003
71.042
+0.328
0.46%
jan 1, 2004
72.821
+1.779
2.5%
jan 1, 2005
74.831
+2.009
2.76%
jan 1, 2006
75.31
+0.48
0.64%
jan 1, 2007
76.629
+1.318
1.75%
jan 1, 2008
78.08
+1.452
1.89%
jan 1, 2009
76.293
-1.787
-2.29%
jan 1, 2010
78.216
+1.923
2.52%
jan 1, 2011
78.198
-0.018
-0.02%
jan 1, 2012
78.811
+0.613
0.78%
jan 1, 2013
78.62
-0.191
-0.24%
jan 1, 2014
78.869
+0.249
0.32%
Ranking of countries by current statistics by years


Comments: