29
/
en
AIzaSyAYiBZKx7MnpbEhh9jyipgxe19OcubqV5w
April 1, 2024
161358
Italy
ITA
true
2
1
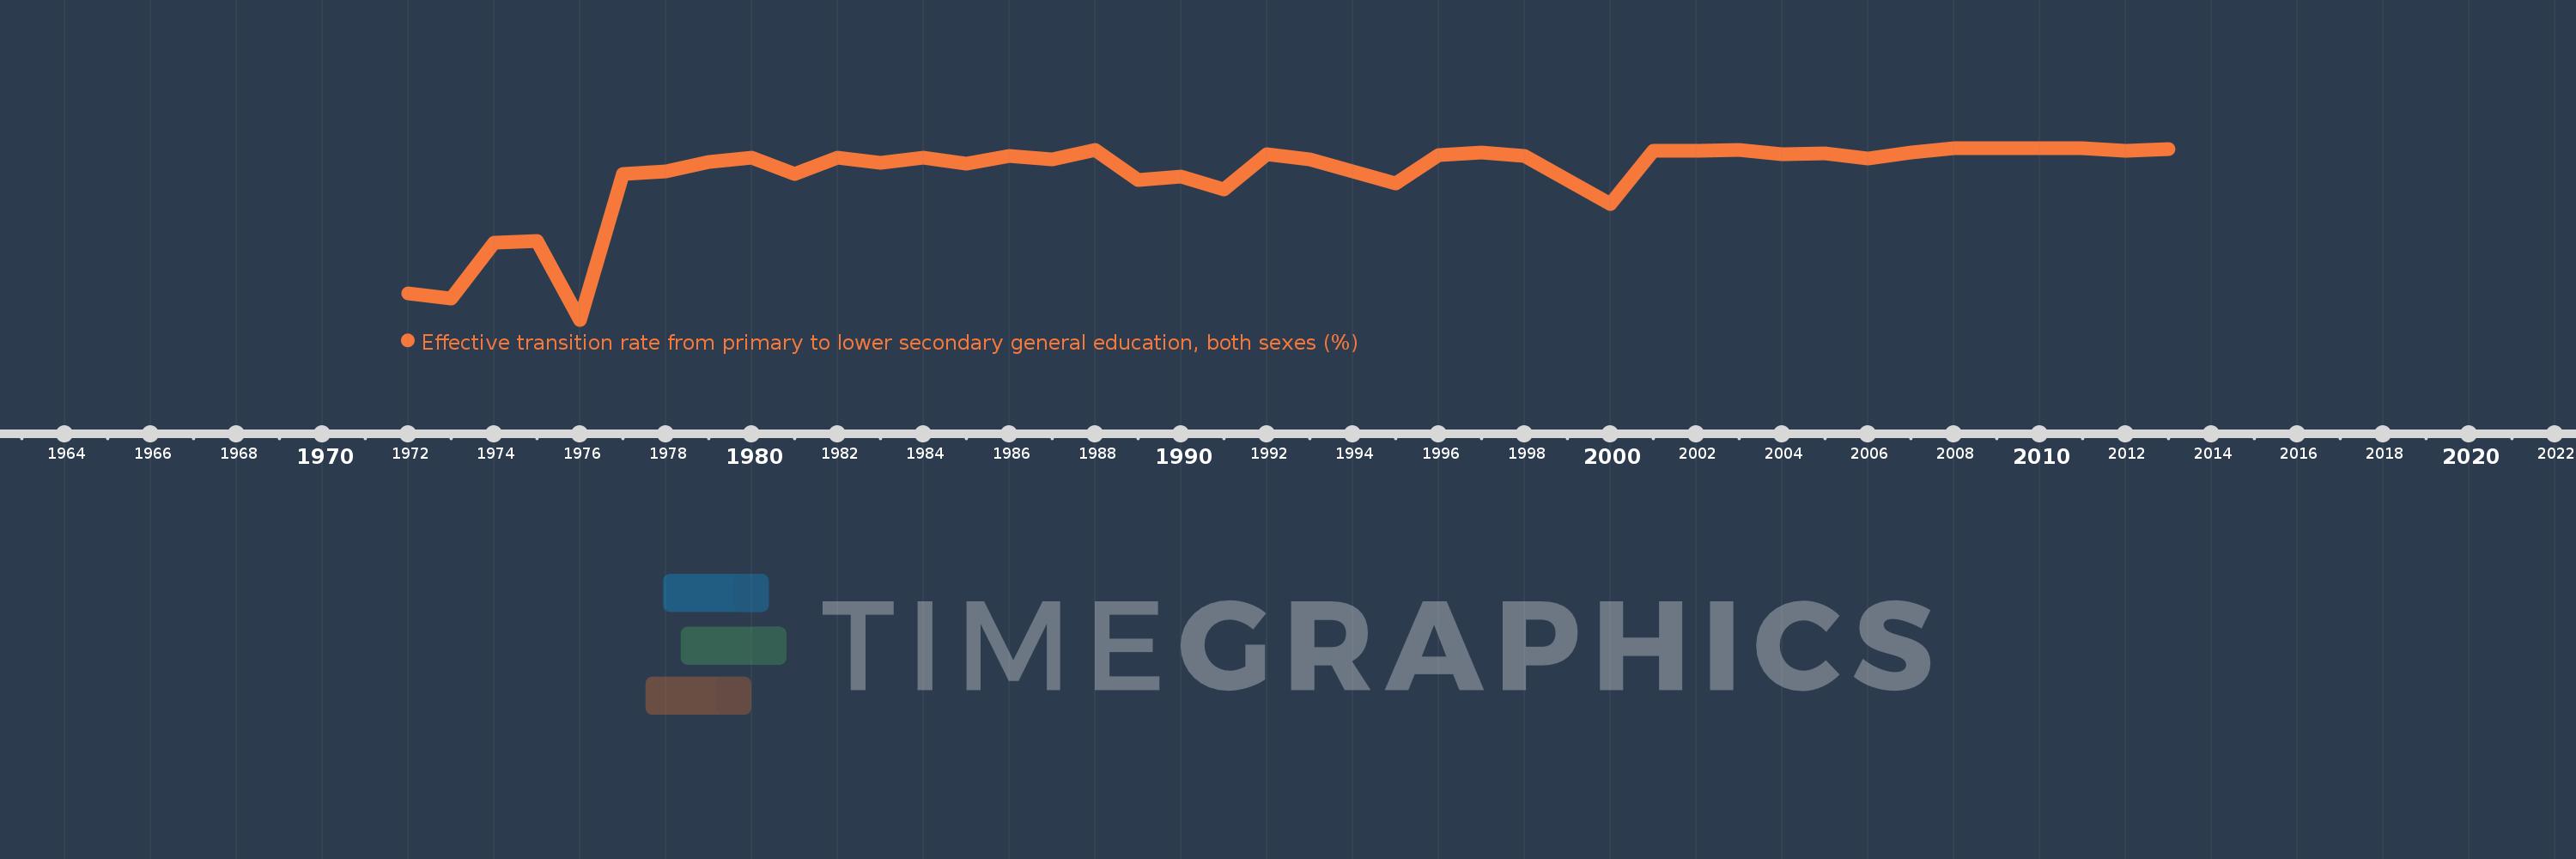
Effective transition rate from primary to lower secondary general education, both sexes (%)
2013,2012,2011,2010,2009,2008,2007,2006,2005,2004,2003,2002,2001,2000,1998,1997,1996,1995,1993,1992,1991,1990,1989,1988,1987,1986,1985,1984,1983,1982,1981,1980,1979,1978,1977,1976,1975,1974,1973,1972
This statistics in other country:
AfghanistanAlbaniaAlgeriaAngolaAntigua and BarbudaArab WorldArgentinaArmeniaArubaAustriaAzerbaijanBahamas, TheBahrainBangladeshBarbadosBelarusBelgiumBelizeBeninBermudaBhutanBoliviaBosnia and HerzegovinaBotswanaBrazilBritish Virgin IslandsBrunei DarussalamBulgariaBurkina FasoBurundiCabo VerdeCambodiaCameroonCaribbean small statesCayman IslandsCentral African RepublicCentral Europe and the BalticsChadChileChinaColombiaComorosCongo, Dem. Rep.Congo, Rep.Costa RicaCote d'IvoireCroatiaCubaCyprusCzech RepublicDenmarkDjiboutiDominicaDominican RepublicEarly-demographic dividendEast Asia & PacificEast Asia & Pacific (excluding high income)East Asia & Pacific (IDA & IBRD countries)EcuadorEgypt, Arab Rep.El SalvadorEquatorial GuineaEritreaEstoniaEthiopiaEuro areaEurope & Central AsiaEurope & Central Asia (excluding high income)Europe & Central Asia (IDA & IBRD countries)European UnionFijiFinlandFragile and conflict affected situationsFranceGabonGambia, TheGeorgiaGermanyGhanaGreeceGrenadaGuatemalaGuineaGuinea-BissauGuyanaHaitiHeavily indebted poor countries (HIPC)High incomeHondurasHong Kong SAR, ChinaHungaryIBRD onlyIcelandIDA & IBRD totalIDA blendIDA onlyIDA totalIndiaIndonesiaIran, Islamic Rep.IraqIsraelItalyJamaicaJapanJordanKazakhstanKenyaKiribatiKorea, Rep.KuwaitKyrgyz RepublicLao PDRLate-demographic dividendLatin America & Caribbean Latin America & Caribbean (excluding high income)Latin America & the Caribbean (IDA & IBRD countries)LatviaLeast developed countries: UN classificationLebanonLesothoLiberiaLibyaLiechtensteinLithuaniaLow & middle incomeLow incomeLower middle incomeLuxembourgMacao SAR, ChinaMacedonia, FYRMadagascarMalawiMalaysiaMaldivesMaliMaltaMarshall IslandsMauritaniaMauritiusMexicoMiddle East & North AfricaMiddle East & North Africa (excluding high income)Middle East & North Africa (IDA & IBRD countries)Middle incomeMoldovaMonacoMongoliaMoroccoMozambiqueMyanmarNamibiaNepalNetherlandsNicaraguaNigerNorwayOECD membersOmanOther small statesPacific island small statesPakistanPalauPanamaParaguayPeruPhilippinesPolandPortugalPost-demographic dividendPre-demographic dividendQatarRomaniaRussian FederationRwandaSamoaSan MarinoSao Tome and PrincipeSaudi ArabiaSenegalSerbiaSeychellesSierra LeoneSingaporeSlovak RepublicSloveniaSmall statesSolomon IslandsSouth AfricaSouth AsiaSouth Asia (IDA & IBRD)SpainSri LankaSt. Kitts and NevisSt. LuciaSt. Vincent and the GrenadinesSub-Saharan Africa Sub-Saharan Africa (excluding high income)Sub-Saharan Africa (IDA & IBRD countries)SudanSurinameSwazilandSwedenSwitzerlandSyrian Arab RepublicTajikistanTanzaniaThailandTimor-LesteTogoTongaTrinidad and TobagoTunisiaTurkeyTurks and Caicos IslandsTuvaluUgandaUkraineUnited Arab EmiratesUpper middle incomeUruguayUzbekistanVanuatuVenezuela, RBVietnamWest Bank and GazaWorldYemen, Rep.ZambiaZimbabwe Timeline:
This timeline shows a graph from 1972 to 2013 of Italy. No data until 1971. Number of actual observations by date: 40.
Source name:
World Development Indicators
Source organization:
UNESCO Institute for Statistics
Categories, topics:
Education
Last updated:
apr 23, 2017
Indicators value changes by year
Minimum:
89.921
jan 1, 1976
Maximum:
99.963
jan 1, 2008
At the date of observation
Value
Absolute change
Change from previous value
jan 1, 1972
91.476
+91.476
0.0%
jan 1, 1973
91.154
-0.321
-0.35%
jan 1, 1974
94.402
+3.247
3.56%
jan 1, 1975
94.53
+0.129
0.14%
jan 1, 1976
89.921
-4.609
-4.88%
jan 1, 1977
98.434
+8.513
9.47%
jan 1, 1978
98.595
+0.161
0.16%
jan 1, 1979
99.129
+0.533
0.54%
jan 1, 1980
99.385
+0.256
0.26%
jan 1, 1981
98.464
-0.921
-0.93%
jan 1, 1982
99.404
+0.94
0.95%
jan 1, 1983
99.077
-0.327
-0.33%
jan 1, 1984
99.413
+0.336
0.34%
jan 1, 1985
99.047
-0.366
-0.37%
jan 1, 1986
99.482
+0.435
0.44%
jan 1, 1987
99.31
-0.172
-0.17%
jan 1, 1988
99.857
+0.547
0.55%
jan 1, 1989
98.078
-1.779
-1.78%
jan 1, 1990
98.311
+0.234
0.24%
jan 1, 1991
97.534
-0.777
-0.79%
jan 1, 1992
99.574
+2.04
2.09%
jan 1, 1993
99.303
-0.271
-0.27%
jan 1, 1995
97.898
-1.405
-1.42%
jan 1, 1996
99.55
+1.652
1.69%
jan 1, 1997
99.718
+0.168
0.17%
jan 1, 1998
99.495
-0.222
-0.22%
jan 1, 2000
96.703
-2.792
-2.81%
jan 1, 2001
99.776
+3.073
3.18%
jan 1, 2002
99.805
+0.029
0.03%
jan 1, 2003
99.835
+0.03
0.03%
jan 1, 2004
99.591
-0.244
-0.24%
jan 1, 2005
99.632
+0.041
0.04%
jan 1, 2006
99.355
-0.277
-0.28%
jan 1, 2007
99.684
+0.328
0.33%
jan 1, 2008
99.963
+0.279
0.28%
jan 1, 2009
99.945
-0.018
-0.02%
jan 1, 2010
99.944
-0.001
0.0%
jan 1, 2011
99.943
0.0
0.0%
jan 1, 2012
99.812
-0.131
-0.13%
jan 1, 2013
99.896
+0.084
0.08%
Ranking of countries by current statistics by years


Comments: