29
/
en
AIzaSyAYiBZKx7MnpbEhh9jyipgxe19OcubqV5w
April 1, 2024
31482
Europe & Central Asia (excluding high income)
ECA
false
2
1
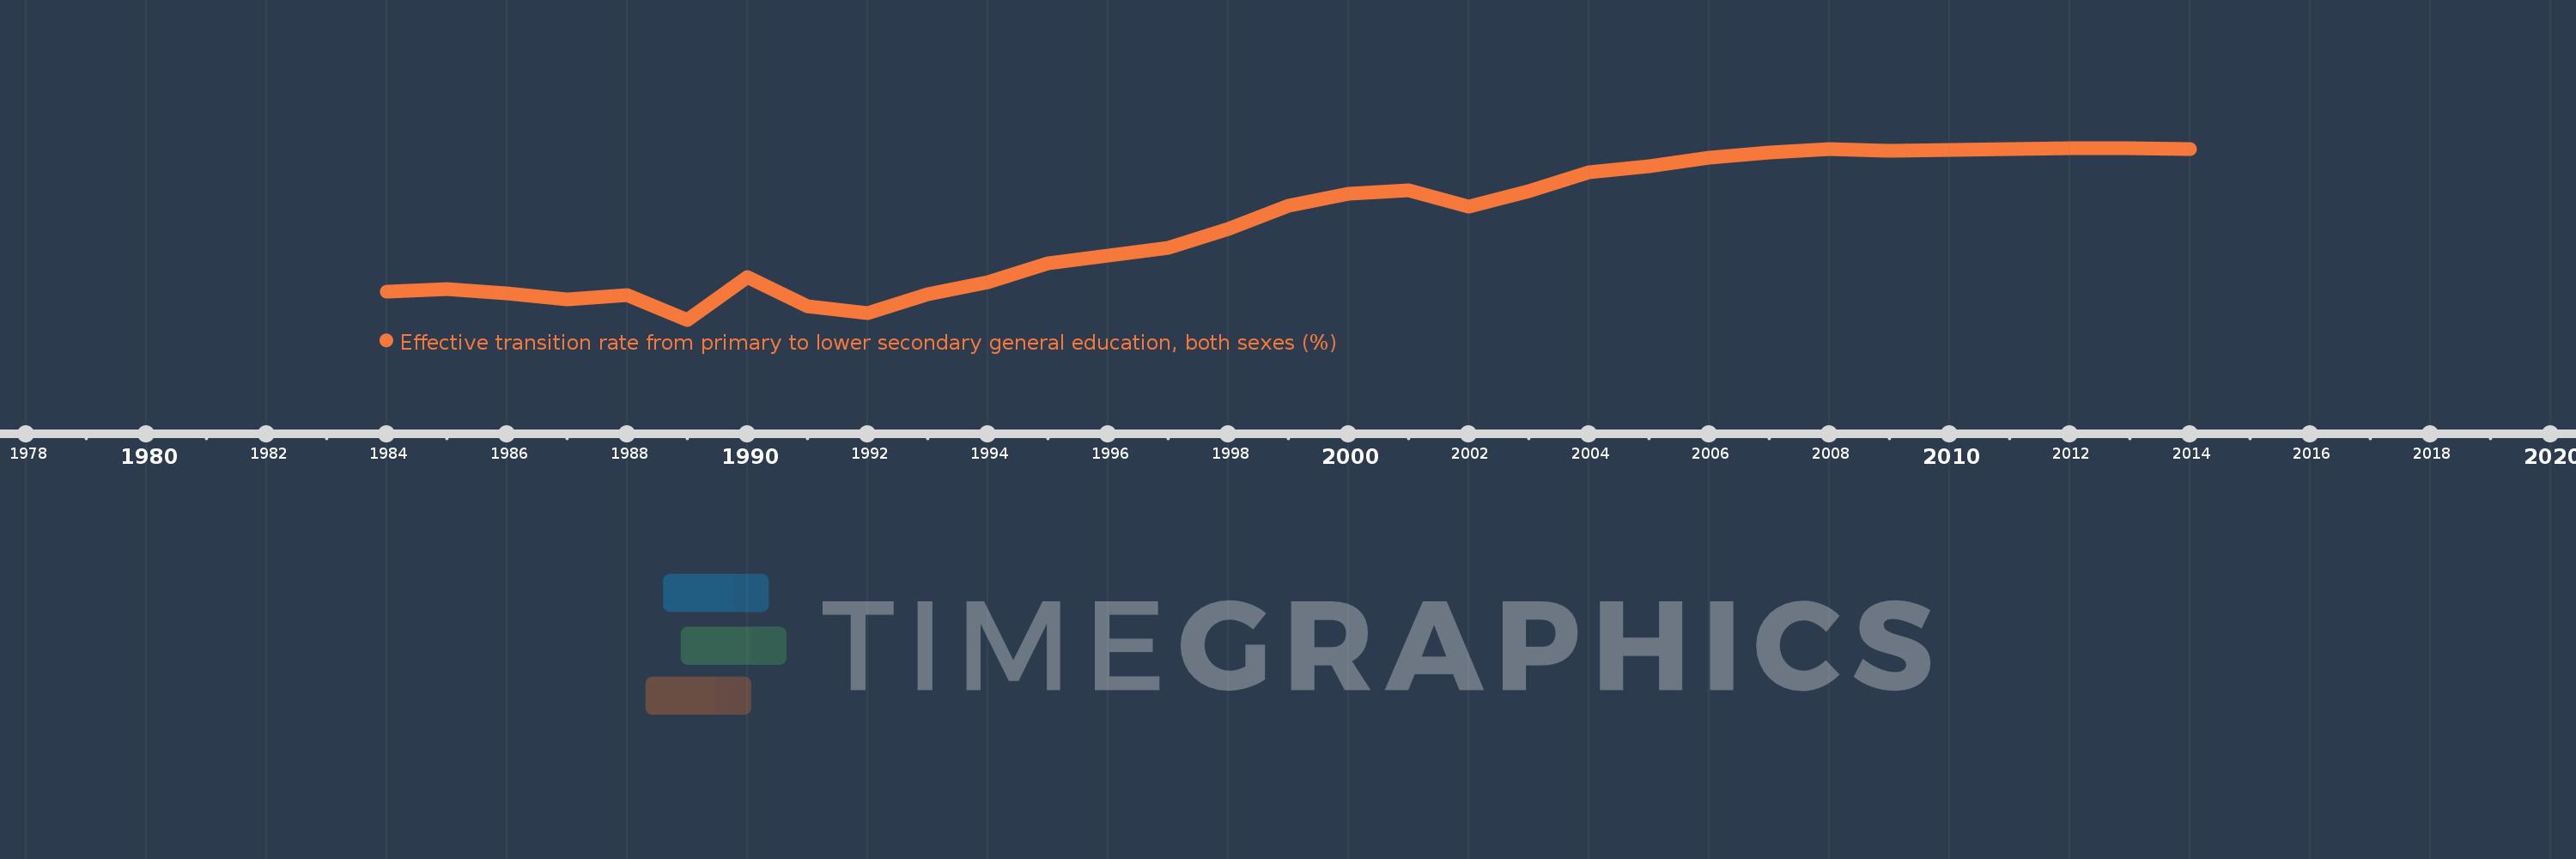
Effective transition rate from primary to lower secondary general education, both sexes (%)
2014,2013,2012,2011,2010,2009,2008,2007,2006,2005,2004,2003,2002,2001,2000,1999,1998,1997,1996,1995,1994,1993,1992,1991,1990,1989,1988,1987,1986,1985,1984
This statistics in other country:
AfghanistanAlbaniaAlgeriaAngolaAntigua and BarbudaArab WorldArgentinaArmeniaArubaAustriaAzerbaijanBahamas, TheBahrainBangladeshBarbadosBelarusBelgiumBelizeBeninBermudaBhutanBoliviaBosnia and HerzegovinaBotswanaBrazilBritish Virgin IslandsBrunei DarussalamBulgariaBurkina FasoBurundiCabo VerdeCambodiaCameroonCaribbean small statesCayman IslandsCentral African RepublicCentral Europe and the BalticsChadChileChinaColombiaComorosCongo, Dem. Rep.Congo, Rep.Costa RicaCote d'IvoireCroatiaCubaCyprusCzech RepublicDenmarkDjiboutiDominicaDominican RepublicEarly-demographic dividendEast Asia & PacificEast Asia & Pacific (excluding high income)East Asia & Pacific (IDA & IBRD countries)EcuadorEgypt, Arab Rep.El SalvadorEquatorial GuineaEritreaEstoniaEthiopiaEuro areaEurope & Central AsiaEurope & Central Asia (excluding high income)Europe & Central Asia (IDA & IBRD countries)European UnionFijiFinlandFragile and conflict affected situationsFranceGabonGambia, TheGeorgiaGermanyGhanaGreeceGrenadaGuatemalaGuineaGuinea-BissauGuyanaHaitiHeavily indebted poor countries (HIPC)High incomeHondurasHong Kong SAR, ChinaHungaryIBRD onlyIcelandIDA & IBRD totalIDA blendIDA onlyIDA totalIndiaIndonesiaIran, Islamic Rep.IraqIsraelItalyJamaicaJapanJordanKazakhstanKenyaKiribatiKorea, Rep.KuwaitKyrgyz RepublicLao PDRLate-demographic dividendLatin America & Caribbean Latin America & Caribbean (excluding high income)Latin America & the Caribbean (IDA & IBRD countries)LatviaLeast developed countries: UN classificationLebanonLesothoLiberiaLibyaLiechtensteinLithuaniaLow & middle incomeLow incomeLower middle incomeLuxembourgMacao SAR, ChinaMacedonia, FYRMadagascarMalawiMalaysiaMaldivesMaliMaltaMarshall IslandsMauritaniaMauritiusMexicoMiddle East & North AfricaMiddle East & North Africa (excluding high income)Middle East & North Africa (IDA & IBRD countries)Middle incomeMoldovaMonacoMongoliaMoroccoMozambiqueMyanmarNamibiaNepalNetherlandsNicaraguaNigerNorwayOECD membersOmanOther small statesPacific island small statesPakistanPalauPanamaParaguayPeruPhilippinesPolandPortugalPost-demographic dividendPre-demographic dividendQatarRomaniaRussian FederationRwandaSamoaSan MarinoSao Tome and PrincipeSaudi ArabiaSenegalSerbiaSeychellesSierra LeoneSingaporeSlovak RepublicSloveniaSmall statesSolomon IslandsSouth AfricaSouth AsiaSouth Asia (IDA & IBRD)SpainSri LankaSt. Kitts and NevisSt. LuciaSt. Vincent and the GrenadinesSub-Saharan Africa Sub-Saharan Africa (excluding high income)Sub-Saharan Africa (IDA & IBRD countries)SudanSurinameSwazilandSwedenSwitzerlandSyrian Arab RepublicTajikistanTanzaniaThailandTimor-LesteTogoTongaTrinidad and TobagoTunisiaTurkeyTurks and Caicos IslandsTuvaluUgandaUkraineUnited Arab EmiratesUpper middle incomeUruguayUzbekistanVanuatuVenezuela, RBVietnamWest Bank and GazaWorldYemen, Rep.ZambiaZimbabwe Timeline:
This timeline shows a graph from 1984 to 2014 of Europe & Central Asia (excluding high income). No data until 1983. Number of actual observations by date: 31.
Source name:
World Development Indicators
Source organization:
UNESCO Institute for Statistics
Categories, topics:
Education
Last updated:
apr 23, 2017
Indicators value changes by year
Minimum:
86.561
jan 1, 1989
Maximum:
99.272
jan 1, 2012
At the date of observation
Value
Absolute change
Change from previous value
jan 1, 1984
88.642
+88.642
0.0%
jan 1, 1985
88.824
+0.182
0.21%
jan 1, 1986
88.487
-0.337
-0.38%
jan 1, 1987
88.078
-0.409
-0.46%
jan 1, 1988
88.375
+0.297
0.34%
jan 1, 1989
86.561
-1.815
-2.05%
jan 1, 1990
89.736
+3.175
3.67%
jan 1, 1991
87.538
-2.198
-2.45%
jan 1, 1992
87.054
-0.484
-0.55%
jan 1, 1993
88.444
+1.39
1.6%
jan 1, 1994
89.349
+0.905
1.02%
jan 1, 1995
90.736
+1.386
1.55%
jan 1, 1996
91.323
+0.588
0.65%
jan 1, 1997
91.885
+0.562
0.62%
jan 1, 1998
93.267
+1.381
1.5%
jan 1, 1999
95.022
+1.755
1.88%
jan 1, 2000
95.857
+0.835
0.88%
jan 1, 2001
96.137
+0.281
0.29%
jan 1, 2002
94.94
-1.198
-1.25%
jan 1, 2003
96.098
+1.159
1.22%
jan 1, 2004
97.478
+1.379
1.44%
jan 1, 2005
97.949
+0.471
0.48%
jan 1, 2006
98.575
+0.627
0.64%
jan 1, 2007
98.926
+0.351
0.36%
jan 1, 2008
99.183
+0.257
0.26%
jan 1, 2009
99.038
-0.145
-0.15%
jan 1, 2010
99.118
+0.08
0.08%
jan 1, 2011
99.217
+0.099
0.1%
jan 1, 2012
99.272
+0.055
0.06%
jan 1, 2013
99.238
-0.035
-0.03%
jan 1, 2014
99.215
-0.022
-0.02%
Ranking of countries by current statistics by years


Comments: