29
/
en
AIzaSyAYiBZKx7MnpbEhh9jyipgxe19OcubqV5w
April 1, 2024
264479
Togo
TGO
true
2
1
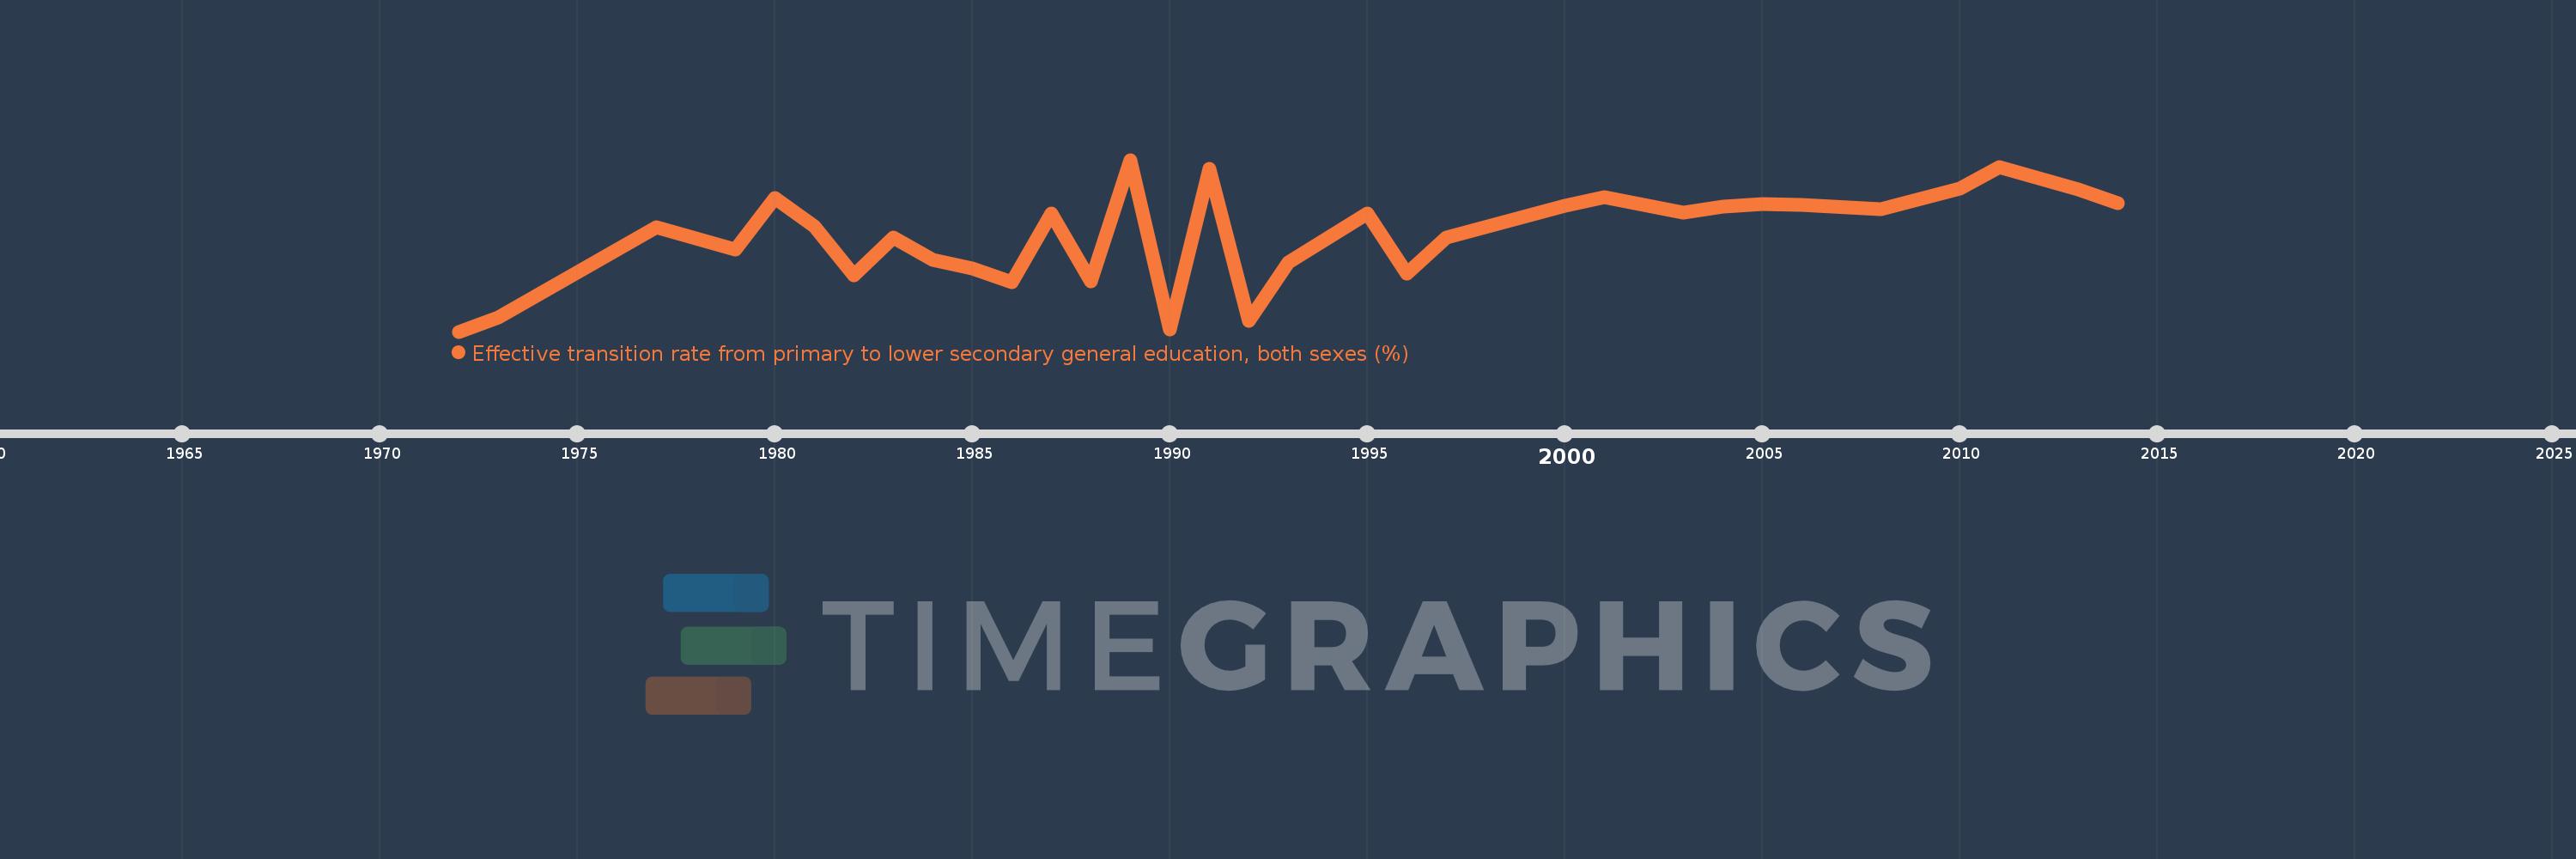
Effective transition rate from primary to lower secondary general education, both sexes (%)
2014,2013,2011,2010,2008,2006,2005,2004,2003,2001,2000,1997,1996,1995,1993,1992,1991,1990,1989,1988,1987,1986,1985,1984,1983,1982,1981,1980,1979,1977,1973,1972
This statistics in other country:
AfghanistanAlbaniaAlgeriaAngolaAntigua and BarbudaArab WorldArgentinaArmeniaArubaAustriaAzerbaijanBahamas, TheBahrainBangladeshBarbadosBelarusBelgiumBelizeBeninBermudaBhutanBoliviaBosnia and HerzegovinaBotswanaBrazilBritish Virgin IslandsBrunei DarussalamBulgariaBurkina FasoBurundiCabo VerdeCambodiaCameroonCaribbean small statesCayman IslandsCentral African RepublicCentral Europe and the BalticsChadChileChinaColombiaComorosCongo, Dem. Rep.Congo, Rep.Costa RicaCote d'IvoireCroatiaCubaCyprusCzech RepublicDenmarkDjiboutiDominicaDominican RepublicEarly-demographic dividendEast Asia & PacificEast Asia & Pacific (excluding high income)East Asia & Pacific (IDA & IBRD countries)EcuadorEgypt, Arab Rep.El SalvadorEquatorial GuineaEritreaEstoniaEthiopiaEuro areaEurope & Central AsiaEurope & Central Asia (excluding high income)Europe & Central Asia (IDA & IBRD countries)European UnionFijiFinlandFragile and conflict affected situationsFranceGabonGambia, TheGeorgiaGermanyGhanaGreeceGrenadaGuatemalaGuineaGuinea-BissauGuyanaHaitiHeavily indebted poor countries (HIPC)High incomeHondurasHong Kong SAR, ChinaHungaryIBRD onlyIcelandIDA & IBRD totalIDA blendIDA onlyIDA totalIndiaIndonesiaIran, Islamic Rep.IraqIsraelItalyJamaicaJapanJordanKazakhstanKenyaKiribatiKorea, Rep.KuwaitKyrgyz RepublicLao PDRLate-demographic dividendLatin America & Caribbean Latin America & Caribbean (excluding high income)Latin America & the Caribbean (IDA & IBRD countries)LatviaLeast developed countries: UN classificationLebanonLesothoLiberiaLibyaLiechtensteinLithuaniaLow & middle incomeLow incomeLower middle incomeLuxembourgMacao SAR, ChinaMacedonia, FYRMadagascarMalawiMalaysiaMaldivesMaliMaltaMarshall IslandsMauritaniaMauritiusMexicoMiddle East & North AfricaMiddle East & North Africa (excluding high income)Middle East & North Africa (IDA & IBRD countries)Middle incomeMoldovaMonacoMongoliaMoroccoMozambiqueMyanmarNamibiaNepalNetherlandsNicaraguaNigerNorwayOECD membersOmanOther small statesPacific island small statesPakistanPalauPanamaParaguayPeruPhilippinesPolandPortugalPost-demographic dividendPre-demographic dividendQatarRomaniaRussian FederationRwandaSamoaSan MarinoSao Tome and PrincipeSaudi ArabiaSenegalSerbiaSeychellesSierra LeoneSingaporeSlovak RepublicSloveniaSmall statesSolomon IslandsSouth AfricaSouth AsiaSouth Asia (IDA & IBRD)SpainSri LankaSt. Kitts and NevisSt. LuciaSt. Vincent and the GrenadinesSub-Saharan Africa Sub-Saharan Africa (excluding high income)Sub-Saharan Africa (IDA & IBRD countries)SudanSurinameSwazilandSwedenSwitzerlandSyrian Arab RepublicTajikistanTanzaniaThailandTimor-LesteTogoTongaTrinidad and TobagoTunisiaTurkeyTurks and Caicos IslandsTuvaluUgandaUkraineUnited Arab EmiratesUpper middle incomeUruguayUzbekistanVanuatuVenezuela, RBVietnamWest Bank and GazaWorldYemen, Rep.ZambiaZimbabwe Timeline:
This timeline shows a graph from 1972 to 2014 of Togo. No data until 1971. Number of actual observations by date: 32.
Source name:
World Development Indicators
Source organization:
UNESCO Institute for Statistics
Categories, topics:
Education
Last updated:
apr 23, 2017
Indicators value changes by year
Minimum:
40.621
jan 1, 1972
Maximum:
93.317
jan 1, 1989
At the date of observation
Value
Absolute change
Change from previous value
jan 1, 1972
40.621
+40.621
0.0%
jan 1, 1973
45.029
+4.408
10.85%
jan 1, 1977
72.671
+27.642
61.39%
jan 1, 1979
65.838
-6.832
-9.4%
jan 1, 1980
81.682
+15.844
24.06%
jan 1, 1981
72.792
-8.891
-10.88%
jan 1, 1982
57.862
-14.93
-20.51%
jan 1, 1983
69.512
+11.65
20.13%
jan 1, 1984
62.537
-6.975
-10.03%
jan 1, 1985
60.007
-2.53
-4.05%
jan 1, 1986
55.865
-4.142
-6.9%
jan 1, 1987
76.777
+20.912
37.43%
jan 1, 1988
56.06
-20.716
-26.98%
jan 1, 1989
93.317
+37.257
66.46%
jan 1, 1990
41.149
-52.167
-55.9%
jan 1, 1991
90.565
+49.415
120.09%
jan 1, 1992
43.784
-46.781
-51.65%
jan 1, 1993
61.908
+18.124
41.39%
jan 1, 1995
76.746
+14.838
23.97%
jan 1, 1996
58.326
-18.421
-24.0%
jan 1, 1997
69.596
+11.27
19.32%
jan 1, 2000
79.18
+9.585
13.77%
jan 1, 2001
81.936
+2.755
3.48%
jan 1, 2003
77.129
-4.807
-5.87%
jan 1, 2004
78.887
+1.758
2.28%
jan 1, 2005
79.816
+0.929
1.18%
jan 1, 2006
79.607
-0.209
-0.26%
jan 1, 2008
78.112
-1.495
-1.88%
jan 1, 2010
84.6
+6.488
8.31%
jan 1, 2011
91.139
+6.539
7.73%
jan 1, 2013
84.293
-6.846
-7.51%
jan 1, 2014
80.048
-4.244
-5.04%
Ranking of countries by current statistics by years


Comments: