29
/
en
AIzaSyAYiBZKx7MnpbEhh9jyipgxe19OcubqV5w
April 1, 2024
258212
Syrian Arab Republic
SYR
true
2
1
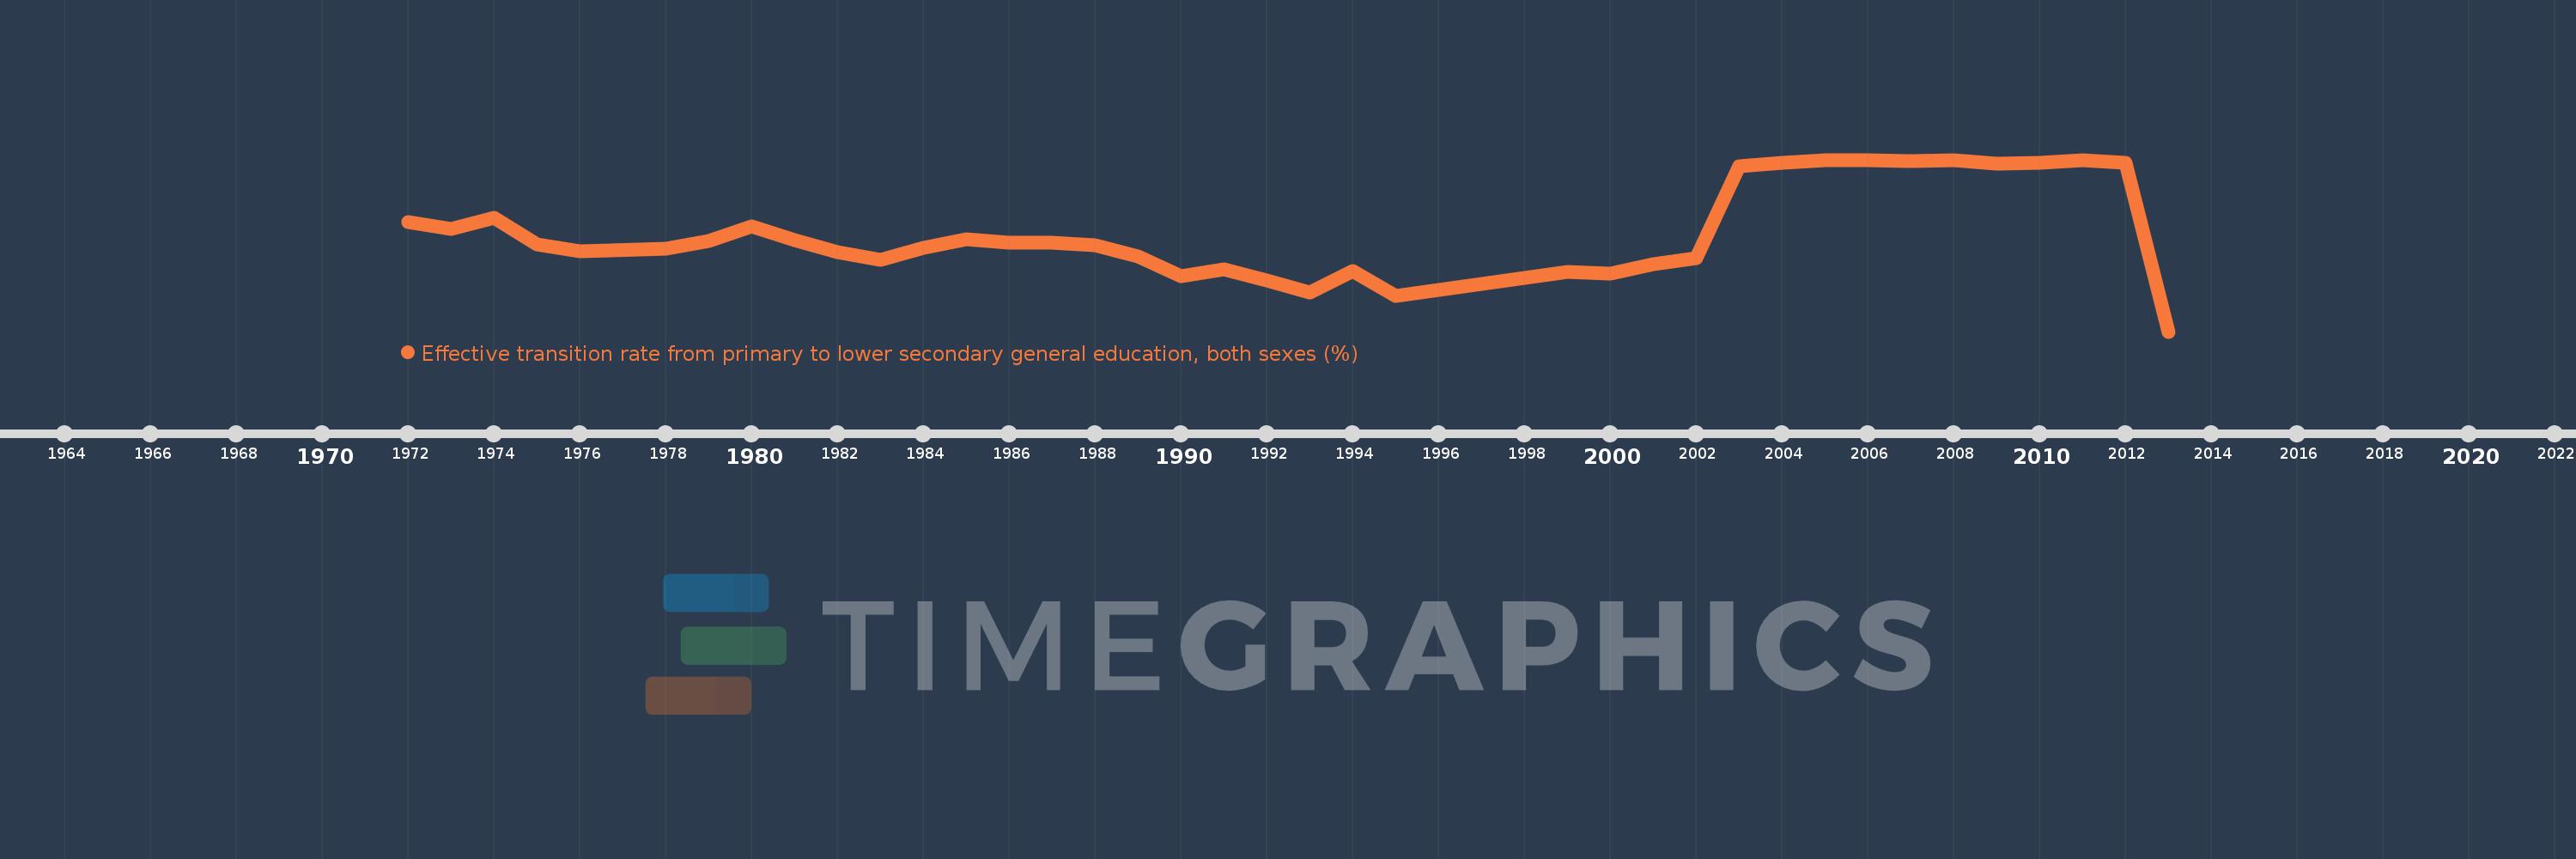
Effective transition rate from primary to lower secondary general education, both sexes (%)
2013,2012,2011,2010,2009,2008,2007,2006,2005,2004,2003,2002,2001,2000,1999,1995,1994,1993,1992,1991,1990,1989,1988,1987,1986,1985,1984,1983,1982,1981,1980,1979,1978,1976,1975,1974,1973,1972
This statistics in other country:
AfghanistanAlbaniaAlgeriaAngolaAntigua and BarbudaArab WorldArgentinaArmeniaArubaAustriaAzerbaijanBahamas, TheBahrainBangladeshBarbadosBelarusBelgiumBelizeBeninBermudaBhutanBoliviaBosnia and HerzegovinaBotswanaBrazilBritish Virgin IslandsBrunei DarussalamBulgariaBurkina FasoBurundiCabo VerdeCambodiaCameroonCaribbean small statesCayman IslandsCentral African RepublicCentral Europe and the BalticsChadChileChinaColombiaComorosCongo, Dem. Rep.Congo, Rep.Costa RicaCote d'IvoireCroatiaCubaCyprusCzech RepublicDenmarkDjiboutiDominicaDominican RepublicEarly-demographic dividendEast Asia & PacificEast Asia & Pacific (excluding high income)East Asia & Pacific (IDA & IBRD countries)EcuadorEgypt, Arab Rep.El SalvadorEquatorial GuineaEritreaEstoniaEthiopiaEuro areaEurope & Central AsiaEurope & Central Asia (excluding high income)Europe & Central Asia (IDA & IBRD countries)European UnionFijiFinlandFragile and conflict affected situationsFranceGabonGambia, TheGeorgiaGermanyGhanaGreeceGrenadaGuatemalaGuineaGuinea-BissauGuyanaHaitiHeavily indebted poor countries (HIPC)High incomeHondurasHong Kong SAR, ChinaHungaryIBRD onlyIcelandIDA & IBRD totalIDA blendIDA onlyIDA totalIndiaIndonesiaIran, Islamic Rep.IraqIsraelItalyJamaicaJapanJordanKazakhstanKenyaKiribatiKorea, Rep.KuwaitKyrgyz RepublicLao PDRLate-demographic dividendLatin America & Caribbean Latin America & Caribbean (excluding high income)Latin America & the Caribbean (IDA & IBRD countries)LatviaLeast developed countries: UN classificationLebanonLesothoLiberiaLibyaLiechtensteinLithuaniaLow & middle incomeLow incomeLower middle incomeLuxembourgMacao SAR, ChinaMacedonia, FYRMadagascarMalawiMalaysiaMaldivesMaliMaltaMarshall IslandsMauritaniaMauritiusMexicoMiddle East & North AfricaMiddle East & North Africa (excluding high income)Middle East & North Africa (IDA & IBRD countries)Middle incomeMoldovaMonacoMongoliaMoroccoMozambiqueMyanmarNamibiaNepalNetherlandsNicaraguaNigerNorwayOECD membersOmanOther small statesPacific island small statesPakistanPalauPanamaParaguayPeruPhilippinesPolandPortugalPost-demographic dividendPre-demographic dividendQatarRomaniaRussian FederationRwandaSamoaSan MarinoSao Tome and PrincipeSaudi ArabiaSenegalSerbiaSeychellesSierra LeoneSingaporeSlovak RepublicSloveniaSmall statesSolomon IslandsSouth AfricaSouth AsiaSouth Asia (IDA & IBRD)SpainSri LankaSt. Kitts and NevisSt. LuciaSt. Vincent and the GrenadinesSub-Saharan Africa Sub-Saharan Africa (excluding high income)Sub-Saharan Africa (IDA & IBRD countries)SudanSurinameSwazilandSwedenSwitzerlandSyrian Arab RepublicTajikistanTanzaniaThailandTimor-LesteTogoTongaTrinidad and TobagoTunisiaTurkeyTurks and Caicos IslandsTuvaluUgandaUkraineUnited Arab EmiratesUpper middle incomeUruguayUzbekistanVanuatuVenezuela, RBVietnamWest Bank and GazaWorldYemen, Rep.ZambiaZimbabwe Timeline:
This timeline shows a graph from 1972 to 2013 of Syrian Arab Republic. No data until 1971. Number of actual observations by date: 38.
Source name:
World Development Indicators
Source organization:
UNESCO Institute for Statistics
Categories, topics:
Education
Last updated:
apr 23, 2017
Indicators value changes by year
Minimum:
57.257
jan 1, 2013
Maximum:
98.648
jan 1, 2008
At the date of observation
Value
Absolute change
Change from previous value
jan 1, 1972
83.678
+83.678
0.0%
jan 1, 1973
81.991
-1.687
-2.02%
jan 1, 1974
84.578
+2.587
3.16%
jan 1, 1975
78.338
-6.24
-7.38%
jan 1, 1976
76.517
-1.821
-2.32%
jan 1, 1978
77.147
+0.63
0.82%
jan 1, 1979
79.029
+1.882
2.44%
jan 1, 1980
82.609
+3.58
4.53%
jan 1, 1981
79.306
-3.303
-4.0%
jan 1, 1982
76.415
-2.891
-3.65%
jan 1, 1983
74.501
-1.914
-2.5%
jan 1, 1984
77.42
+2.919
3.92%
jan 1, 1985
79.461
+2.042
2.64%
jan 1, 1986
78.577
-0.884
-1.11%
jan 1, 1987
78.692
+0.115
0.15%
jan 1, 1988
77.993
-0.7
-0.89%
jan 1, 1989
75.416
-2.576
-3.3%
jan 1, 1990
70.567
-4.849
-6.43%
jan 1, 1991
72.294
+1.727
2.45%
jan 1, 1992
69.55
-2.744
-3.8%
jan 1, 1993
66.669
-2.881
-4.14%
jan 1, 1994
71.844
+5.175
7.76%
jan 1, 1995
65.94
-5.904
-8.22%
jan 1, 1999
71.705
+5.765
8.74%
jan 1, 2000
71.184
-0.52
-0.73%
jan 1, 2001
73.489
+2.305
3.24%
jan 1, 2002
75.007
+1.518
2.07%
jan 1, 2003
97.007
+22.0
29.33%
jan 1, 2004
97.822
+0.815
0.84%
jan 1, 2005
98.462
+0.64
0.65%
jan 1, 2006
98.571
+0.11
0.11%
jan 1, 2007
98.353
-0.218
-0.22%
jan 1, 2008
98.648
+0.295
0.3%
jan 1, 2009
97.68
-0.968
-0.98%
jan 1, 2010
97.914
+0.234
0.24%
jan 1, 2011
98.509
+0.596
0.61%
jan 1, 2012
97.869
-0.64
-0.65%
jan 1, 2013
57.257
-40.612
-41.5%
Ranking of countries by current statistics by years


Comments: