29
/
en
AIzaSyAYiBZKx7MnpbEhh9jyipgxe19OcubqV5w
April 1, 2024
113470
Cote d'Ivoire
CIV
true
2
1
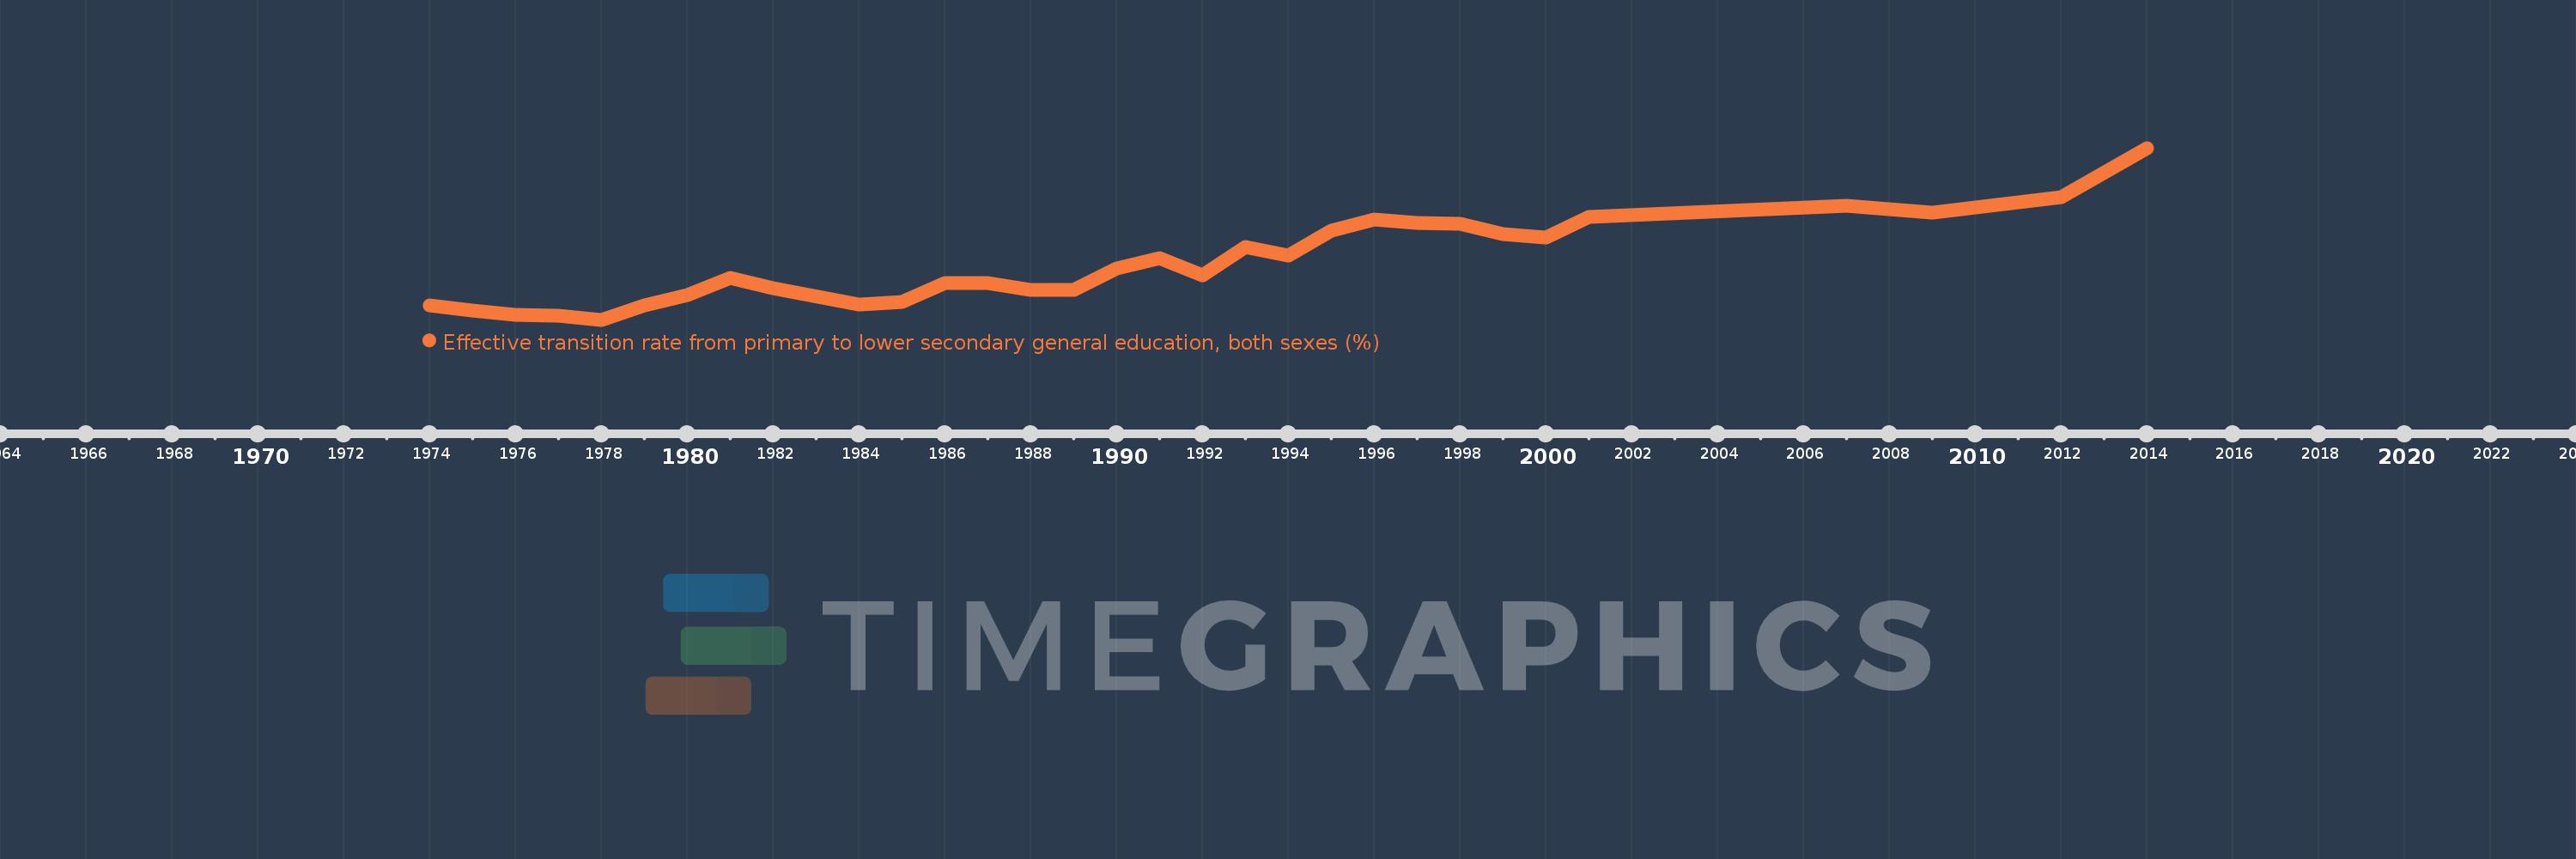
Effective transition rate from primary to lower secondary general education, both sexes (%)
2014,2012,2009,2007,2001,2000,1999,1998,1997,1996,1995,1994,1993,1992,1991,1990,1989,1988,1987,1986,1985,1984,1982,1981,1980,1979,1978,1977,1976,1975,1974
This statistics in other country:
AfghanistanAlbaniaAlgeriaAngolaAntigua and BarbudaArab WorldArgentinaArmeniaArubaAustriaAzerbaijanBahamas, TheBahrainBangladeshBarbadosBelarusBelgiumBelizeBeninBermudaBhutanBoliviaBosnia and HerzegovinaBotswanaBrazilBritish Virgin IslandsBrunei DarussalamBulgariaBurkina FasoBurundiCabo VerdeCambodiaCameroonCaribbean small statesCayman IslandsCentral African RepublicCentral Europe and the BalticsChadChileChinaColombiaComorosCongo, Dem. Rep.Congo, Rep.Costa RicaCote d'IvoireCroatiaCubaCyprusCzech RepublicDenmarkDjiboutiDominicaDominican RepublicEarly-demographic dividendEast Asia & PacificEast Asia & Pacific (excluding high income)East Asia & Pacific (IDA & IBRD countries)EcuadorEgypt, Arab Rep.El SalvadorEquatorial GuineaEritreaEstoniaEthiopiaEuro areaEurope & Central AsiaEurope & Central Asia (excluding high income)Europe & Central Asia (IDA & IBRD countries)European UnionFijiFinlandFragile and conflict affected situationsFranceGabonGambia, TheGeorgiaGermanyGhanaGreeceGrenadaGuatemalaGuineaGuinea-BissauGuyanaHaitiHeavily indebted poor countries (HIPC)High incomeHondurasHong Kong SAR, ChinaHungaryIBRD onlyIcelandIDA & IBRD totalIDA blendIDA onlyIDA totalIndiaIndonesiaIran, Islamic Rep.IraqIsraelItalyJamaicaJapanJordanKazakhstanKenyaKiribatiKorea, Rep.KuwaitKyrgyz RepublicLao PDRLate-demographic dividendLatin America & Caribbean Latin America & Caribbean (excluding high income)Latin America & the Caribbean (IDA & IBRD countries)LatviaLeast developed countries: UN classificationLebanonLesothoLiberiaLibyaLiechtensteinLithuaniaLow & middle incomeLow incomeLower middle incomeLuxembourgMacao SAR, ChinaMacedonia, FYRMadagascarMalawiMalaysiaMaldivesMaliMaltaMarshall IslandsMauritaniaMauritiusMexicoMiddle East & North AfricaMiddle East & North Africa (excluding high income)Middle East & North Africa (IDA & IBRD countries)Middle incomeMoldovaMonacoMongoliaMoroccoMozambiqueMyanmarNamibiaNepalNetherlandsNicaraguaNigerNorwayOECD membersOmanOther small statesPacific island small statesPakistanPalauPanamaParaguayPeruPhilippinesPolandPortugalPost-demographic dividendPre-demographic dividendQatarRomaniaRussian FederationRwandaSamoaSan MarinoSao Tome and PrincipeSaudi ArabiaSenegalSerbiaSeychellesSierra LeoneSingaporeSlovak RepublicSloveniaSmall statesSolomon IslandsSouth AfricaSouth AsiaSouth Asia (IDA & IBRD)SpainSri LankaSt. Kitts and NevisSt. LuciaSt. Vincent and the GrenadinesSub-Saharan Africa Sub-Saharan Africa (excluding high income)Sub-Saharan Africa (IDA & IBRD countries)SudanSurinameSwazilandSwedenSwitzerlandSyrian Arab RepublicTajikistanTanzaniaThailandTimor-LesteTogoTongaTrinidad and TobagoTunisiaTurkeyTurks and Caicos IslandsTuvaluUgandaUkraineUnited Arab EmiratesUpper middle incomeUruguayUzbekistanVanuatuVenezuela, RBVietnamWest Bank and GazaWorldYemen, Rep.ZambiaZimbabwe Timeline:
This timeline shows a graph from 1974 to 2014 of Cote d'Ivoire. No data until 1973. Number of actual observations by date: 31.
Source name:
World Development Indicators
Source organization:
UNESCO Institute for Statistics
Categories, topics:
Education
Last updated:
apr 23, 2017
Indicators value changes by year
Minimum:
36.992
jan 1, 1978
Maximum:
87.984
jan 1, 2014
At the date of observation
Value
Absolute change
Change from previous value
jan 1, 1974
41.181
+41.181
0.0%
jan 1, 1975
39.631
-1.55
-3.76%
jan 1, 1976
38.327
-1.305
-3.29%
jan 1, 1977
38.212
-0.115
-0.3%
jan 1, 1978
36.992
-1.22
-3.19%
jan 1, 1979
41.316
+4.323
11.69%
jan 1, 1980
44.337
+3.021
7.31%
jan 1, 1981
49.298
+4.96
11.19%
jan 1, 1982
46.47
-2.827
-5.73%
jan 1, 1984
41.611
-4.859
-10.46%
jan 1, 1985
42.201
+0.59
1.42%
jan 1, 1986
47.855
+5.654
13.4%
jan 1, 1987
47.912
+0.056
0.12%
jan 1, 1988
45.749
-2.163
-4.51%
jan 1, 1989
45.825
+0.076
0.17%
jan 1, 1990
52.224
+6.399
13.96%
jan 1, 1991
55.355
+3.132
6.0%
jan 1, 1992
50.141
-5.214
-9.42%
jan 1, 1993
58.71
+8.569
17.09%
jan 1, 1994
55.989
-2.721
-4.63%
jan 1, 1995
63.323
+7.333
13.1%
jan 1, 1996
66.658
+3.335
5.27%
jan 1, 1997
65.723
-0.935
-1.4%
jan 1, 1998
65.466
-0.256
-0.39%
jan 1, 1999
62.364
-3.103
-4.74%
jan 1, 2000
61.511
-0.852
-1.37%
jan 1, 2001
67.471
+5.96
9.69%
jan 1, 2007
70.726
+3.255
4.82%
jan 1, 2009
68.763
-1.963
-2.78%
jan 1, 2012
73.475
+4.712
6.85%
jan 1, 2014
87.984
+14.508
19.75%
Ranking of countries by current statistics by years


Comments: