29
/
en
AIzaSyAYiBZKx7MnpbEhh9jyipgxe19OcubqV5w
April 1, 2024
65874
Algeria
DZA
true
2
1
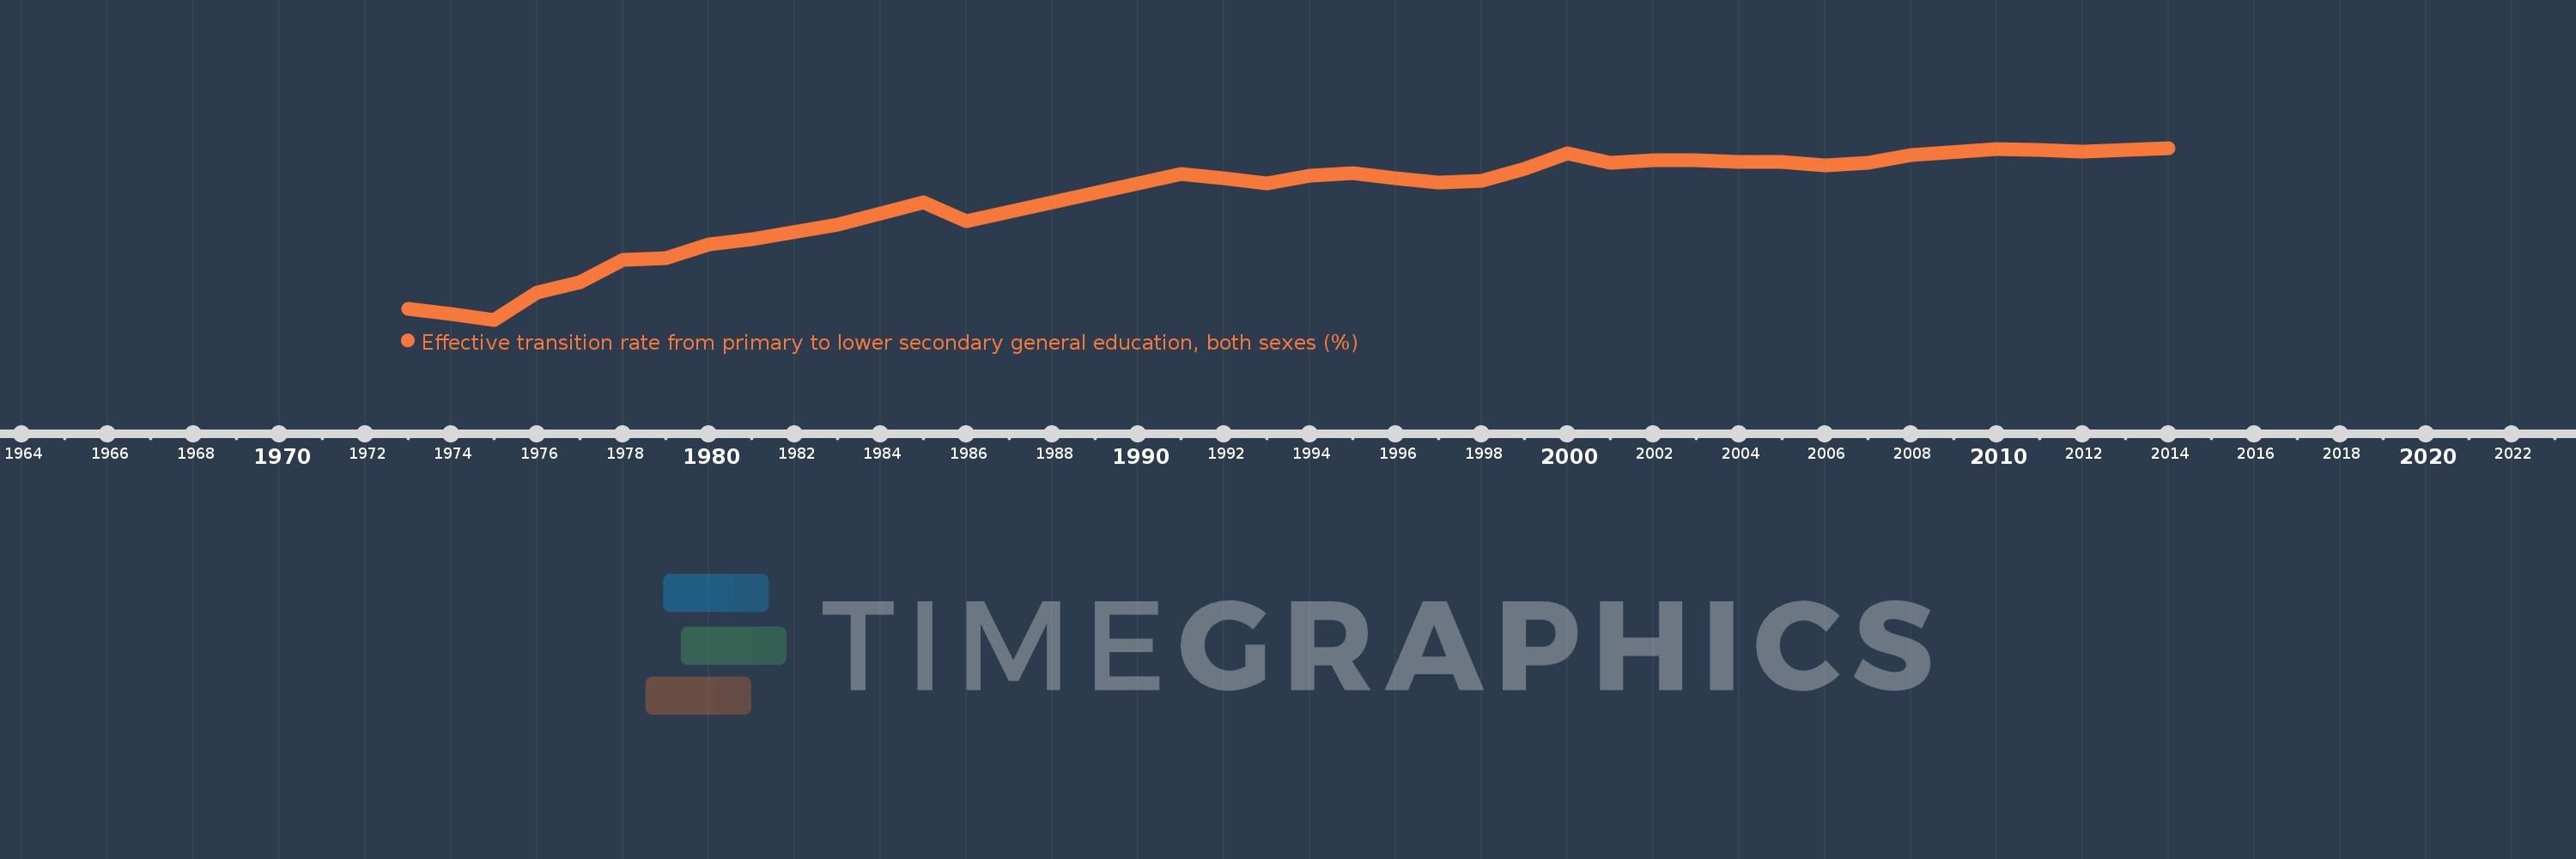
Effective transition rate from primary to lower secondary general education, both sexes (%)
2014,2013,2012,2011,2010,2008,2007,2006,2005,2004,2003,2002,2001,2000,1999,1998,1997,1996,1995,1994,1993,1992,1991,1990,1986,1985,1983,1981,1980,1979,1978,1977,1976,1975,1974,1973
This statistics in other country:
AfghanistanAlbaniaAlgeriaAngolaAntigua and BarbudaArab WorldArgentinaArmeniaArubaAustriaAzerbaijanBahamas, TheBahrainBangladeshBarbadosBelarusBelgiumBelizeBeninBermudaBhutanBoliviaBosnia and HerzegovinaBotswanaBrazilBritish Virgin IslandsBrunei DarussalamBulgariaBurkina FasoBurundiCabo VerdeCambodiaCameroonCaribbean small statesCayman IslandsCentral African RepublicCentral Europe and the BalticsChadChileChinaColombiaComorosCongo, Dem. Rep.Congo, Rep.Costa RicaCote d'IvoireCroatiaCubaCyprusCzech RepublicDenmarkDjiboutiDominicaDominican RepublicEarly-demographic dividendEast Asia & PacificEast Asia & Pacific (excluding high income)East Asia & Pacific (IDA & IBRD countries)EcuadorEgypt, Arab Rep.El SalvadorEquatorial GuineaEritreaEstoniaEthiopiaEuro areaEurope & Central AsiaEurope & Central Asia (excluding high income)Europe & Central Asia (IDA & IBRD countries)European UnionFijiFinlandFragile and conflict affected situationsFranceGabonGambia, TheGeorgiaGermanyGhanaGreeceGrenadaGuatemalaGuineaGuinea-BissauGuyanaHaitiHeavily indebted poor countries (HIPC)High incomeHondurasHong Kong SAR, ChinaHungaryIBRD onlyIcelandIDA & IBRD totalIDA blendIDA onlyIDA totalIndiaIndonesiaIran, Islamic Rep.IraqIsraelItalyJamaicaJapanJordanKazakhstanKenyaKiribatiKorea, Rep.KuwaitKyrgyz RepublicLao PDRLate-demographic dividendLatin America & Caribbean Latin America & Caribbean (excluding high income)Latin America & the Caribbean (IDA & IBRD countries)LatviaLeast developed countries: UN classificationLebanonLesothoLiberiaLibyaLiechtensteinLithuaniaLow & middle incomeLow incomeLower middle incomeLuxembourgMacao SAR, ChinaMacedonia, FYRMadagascarMalawiMalaysiaMaldivesMaliMaltaMarshall IslandsMauritaniaMauritiusMexicoMiddle East & North AfricaMiddle East & North Africa (excluding high income)Middle East & North Africa (IDA & IBRD countries)Middle incomeMoldovaMonacoMongoliaMoroccoMozambiqueMyanmarNamibiaNepalNetherlandsNicaraguaNigerNorwayOECD membersOmanOther small statesPacific island small statesPakistanPalauPanamaParaguayPeruPhilippinesPolandPortugalPost-demographic dividendPre-demographic dividendQatarRomaniaRussian FederationRwandaSamoaSan MarinoSao Tome and PrincipeSaudi ArabiaSenegalSerbiaSeychellesSierra LeoneSingaporeSlovak RepublicSloveniaSmall statesSolomon IslandsSouth AfricaSouth AsiaSouth Asia (IDA & IBRD)SpainSri LankaSt. Kitts and NevisSt. LuciaSt. Vincent and the GrenadinesSub-Saharan Africa Sub-Saharan Africa (excluding high income)Sub-Saharan Africa (IDA & IBRD countries)SudanSurinameSwazilandSwedenSwitzerlandSyrian Arab RepublicTajikistanTanzaniaThailandTimor-LesteTogoTongaTrinidad and TobagoTunisiaTurkeyTurks and Caicos IslandsTuvaluUgandaUkraineUnited Arab EmiratesUpper middle incomeUruguayUzbekistanVanuatuVenezuela, RBVietnamWest Bank and GazaWorldYemen, Rep.ZambiaZimbabwe Timeline:
This timeline shows a graph from 1973 to 2014 of Algeria. No data until 1972. Number of actual observations by date: 36.
Source name:
World Development Indicators
Source organization:
UNESCO Institute for Statistics
Categories, topics:
Education
Last updated:
apr 23, 2017
Indicators value changes by year
Minimum:
29.162
jan 1, 1975
Maximum:
99.392
jan 1, 2014
At the date of observation
Value
Absolute change
Change from previous value
jan 1, 1973
33.542
+33.542
0.0%
jan 1, 1974
31.51
-2.032
-6.06%
jan 1, 1975
29.162
-2.348
-7.45%
jan 1, 1976
40.345
+11.183
38.35%
jan 1, 1977
44.67
+4.325
10.72%
jan 1, 1978
53.481
+8.811
19.73%
jan 1, 1979
54.403
+0.922
1.72%
jan 1, 1980
59.998
+5.596
10.29%
jan 1, 1981
61.99
+1.991
3.32%
jan 1, 1983
68.003
+6.013
9.7%
jan 1, 1985
77.025
+9.022
13.27%
jan 1, 1986
69.363
-7.661
-9.95%
jan 1, 1990
84.977
+15.614
22.51%
jan 1, 1991
88.895
+3.918
4.61%
jan 1, 1992
87.077
-1.818
-2.04%
jan 1, 1993
85.015
-2.062
-2.37%
jan 1, 1994
88.0
+2.985
3.51%
jan 1, 1995
89.083
+1.083
1.23%
jan 1, 1996
87.036
-2.047
-2.3%
jan 1, 1997
85.126
-1.91
-2.19%
jan 1, 1998
85.908
+0.782
0.92%
jan 1, 1999
90.836
+4.928
5.74%
jan 1, 2000
97.113
+6.277
6.91%
jan 1, 2001
93.257
-3.855
-3.97%
jan 1, 2002
94.472
+1.214
1.3%
jan 1, 2003
94.469
-0.002
0.0%
jan 1, 2004
93.796
-0.673
-0.71%
jan 1, 2005
93.743
-0.053
-0.06%
jan 1, 2006
92.314
-1.43
-1.52%
jan 1, 2007
93.239
+0.925
1.0%
jan 1, 2008
96.584
+3.345
3.59%
jan 1, 2010
98.913
+2.33
2.41%
jan 1, 2011
98.574
-0.339
-0.34%
jan 1, 2012
97.731
-0.843
-0.86%
jan 1, 2013
98.516
+0.784
0.8%
jan 1, 2014
99.392
+0.876
0.89%
Ranking of countries by current statistics by years


Comments: